Sunlit images of Earth, such as those we frequently see from weather satellites, provide us with beautiful and detailed information about our planet. But there is much more to learn beyond what our eyes can naturally see. Scientists also study Earth using invisible infrared wavelengths of light, providing additional ways of observing Earth’s features and processes often hidden from our view.
Seeing Earth in a New Light
Infrared energy or "light" is part of the electromagnetic spectrum, which is the range of different types of electrical and magnetic energy in the universe. Along the spectrum, warm infrared energy sits just to the left of visible light and is what we use to observe heat and other characteristics of objects.
Observing Earth through infrared light is particularly helpful for studying weather events, climate, objects and surfaces that are faint or obscured by smoke and other cover, or elements that are hard to visually differentiate.
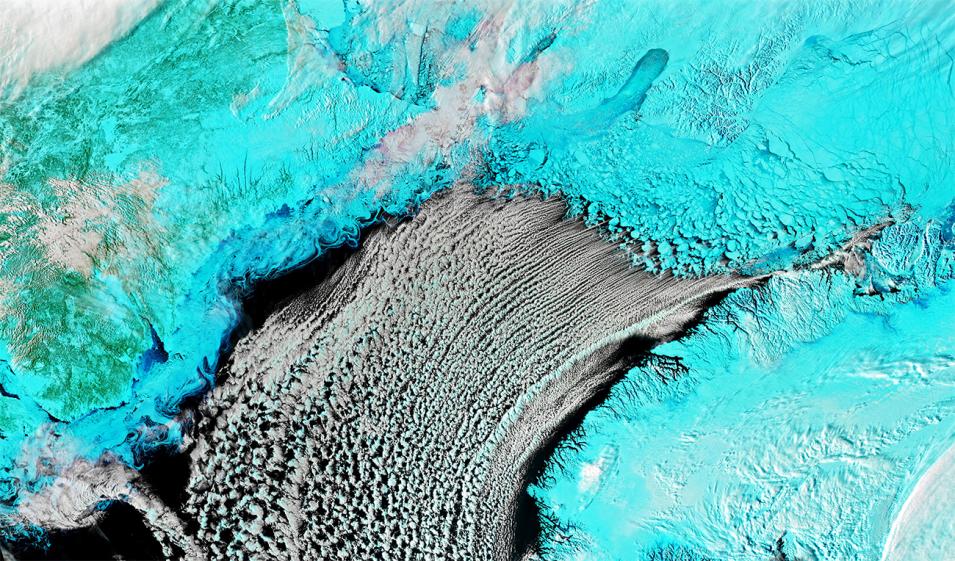
Infrared imagery can help make objects that look confusingly similar in visual light (such as clouds over sea ice) appear noticeably different. This false color image from the Suomi NPP VIIRS sensor shows sea ice and the Greenland land mass in teal while clouds appear white. Credit: NASA Earth Observatory image by Joshua Stevens using VIIRS data from LANCE, Worldview, and Suomi NPP.
"One great example is snow and clouds," said Robert Wolfe, chief of the Terrestrial Information Systems Laboratory at NASA’s Goddard Space Flight Center in Greenbelt, Maryland. "If an astronaut is looking down from space, snow can look very much like a cloud."
Making accurate measurements of snow and clouds using visible light images can be difficult. But, as Wolfe points out, snow and clouds absorb and reflect infrared sunlight differently, and those differences can be measured, compared, and used to easily tell them apart.
Infrared Instruments
NASA and other space organizations have been flying satellites with infrared sensors for nearly 50 years. Today, key NASA and joint-NASA spacecraft with sensors for examining Earth in infrared light are the Terra, Aqua, Suomi National Polar-orbiting Partnership (Suomi NPP), NOAA-20, and the Landsat series of satellites.
Terra is equipped with the Advanced Spaceborne Thermal Emission and Reflection Radiometer (ASTER)—a sensor used primarily for geological material mapping. Aqua flies with the Atmospheric Infrared Sounder (AIRS) instrument, which is used to gather 3D measurements of temperature and water vapor through the atmospheric column. Both satellites are equipped with the Moderate Resolution Imaging Spectroradiometer (MODIS) and the Clouds and the Earth’s Energy Radiant System (CERES) infrared-sensing instruments. MODIS and CERES scan Earth for reflected and radiated infrared light to survey its land, oceans, and atmosphere.
The joint NASA/NOAA Suomi NPP and NOAA-20 satellites carry the CERES instrument along with the Visible Infrared Imaging Radiometer Suite (VIIRS) instrument. VIIRS aids scientists studying how infrared heat is driving short-term weather events.
The joint NASA/USGS Landsat 8 and 9 satellites carry the Thermal Infrared Sensor (TIRS) and TIRS-2, respectively, which measure land surface temperature.
Views of the Infrared World
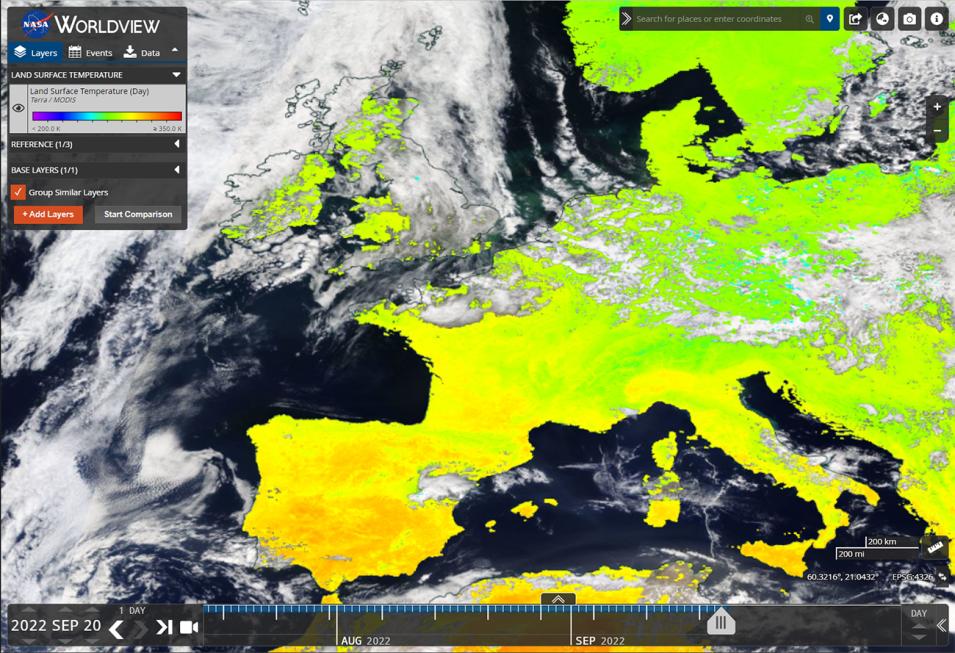
Anyone who wants to see and use infrared data can access much of it through the NASA Worldview satellite imagery exploration tool. Worldview allows users to layer images, maps, and other information on top of each other. Many images are updated daily and some are updated as often as every 10 minutes, essentially showing Earth as it looks right now.
“People think Worldview is really cool,” said Minnie Wong, the Worldview systems engineer and product owner. “It has a lot of great features, such as the ability to choose from 1,000 different image types or layers. You can compare layers and images from different days, create animated GIFs, and easily download the underlying data using Earthdata Search.”
Worldview’s power to provide remarkably current data makes it valuable for researchers and professionals working in fire and natural resources management, air quality assessment, disaster response, and other areas where up-to-date IR data are critical for emergency response and event monitoring. When storms, fires, and other significant events are taking place, Worldview's Events tab offers easy access to pre-selected imagery that is most helpful in understanding them.
The ability of infrared sensors to detect radiated heat makes them ideal for identifying wildfires and other thermal anomalies. To track wildfires, NASA operates the Fire Information for Resource Management System (FIRMS). Similar to NASA Worldview, FIRMS offers a visual dashboard of maps and satellite images researchers and other experts can use to track active wildland fires around the world. Fire locations and other data are gathered from infrared sensors aboard the Suomi NPP, NOAA-20, Aqua, and Terra satellites.
“FIRMS provides a global view of where fires and other thermal anomalies are occurring and this can be incredibly useful—particularly in remote areas, where active fire data provided through FIRMS is often the first notification of a fire,” said Diane Davies, the operations manager for NASA’s Land Atmosphere Near-real-time Capability for EOS (LANCE), which houses FIRMS. “Active fire detections can be viewed interactively using the FIRMS Fire Map application, and active fire data can be downloaded in easy-to-use formats, delivered through email alerts, or ingested through a web service.”
Seeing the Unseen
Data acquired from satellites equipped with infrared sensors have broad applications and provide powerful scientific insight. Data visualizers produce infrared images we can look at by pairing measurements of the same amount of infrared energy with a particular color, creating a “false color” image. Imagine the images we see from a heat gun that show cooler spots with less infrared energy as darkly colored areas and hotter sections as brighter, lighter colors.
“One of the great aspects of infrared is just how useful it is,” said Joshua Stevens, the lead data visualizer of NASA’s Earth Observatory. “You can use it to study a wide array of things such as the health of vegetation, flood regions, and fires, and we have high-quality data going all the way back to the 1970’s and 80’s.”
Infrared imaging can be useful for analyzing a range of interests including large toxic algae blooms, land surface temperatures, storm damage, vegetation coverage, or polar regions during periods of seasonal darkness. Below are additional vivid examples of what we can study across Earth through infrared light (click on individual images for a larger view).
Water Detection and Flood Monitoring
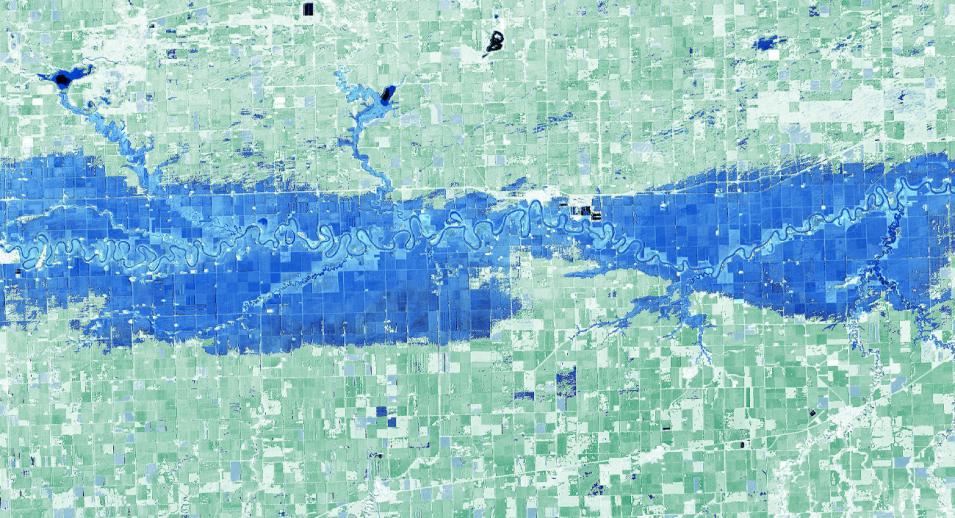
Like snow and clouds, muddy flood waters can be hard to differentiate from land. Infrared images make it easier to see where water ends and land starts, aiding scientists and officials in estimating damage and understanding flooding processes. This image from Landsat 8 reveals the extent of flooding of rural farmland in Minnesota and North Dakota when the Red River overflowed its banks in 2020. The areas in green are farmland and the blue regions show the river and floodwaters.
Urban Heat Islands
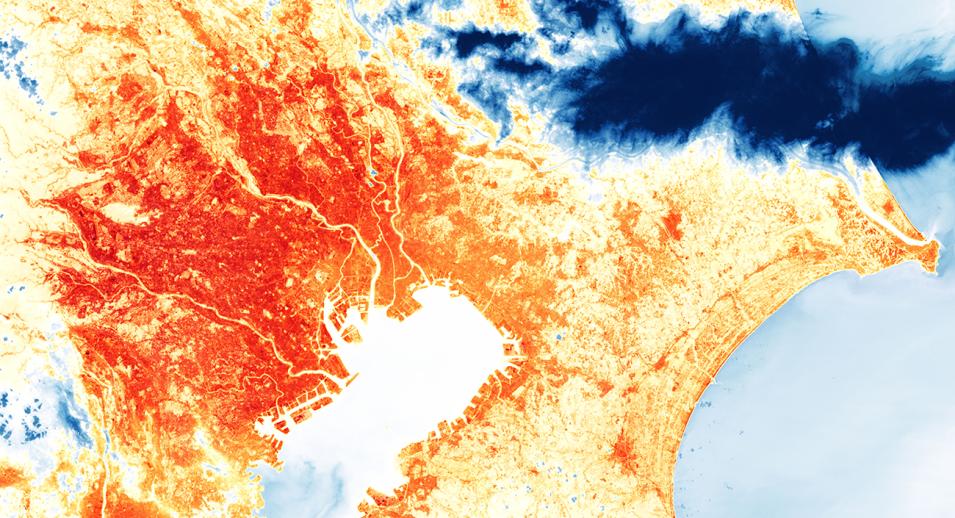
Intensifying summer heat waves along with heat absorbed and produced by cities make them warmer than the surrounding suburban and rural areas. From space, cities appear as warmer “heat islands” when scientists measure their temperature using satellites equipped with infrared sensors. In 2019, scientists used Landsat 8’s TIRS sensor to capture this image of Tokyo on a 90°F day. In the image the coolest areas of Tokyo are colored white to yellow and warmer areas are orange to red.
Prospecting From Space
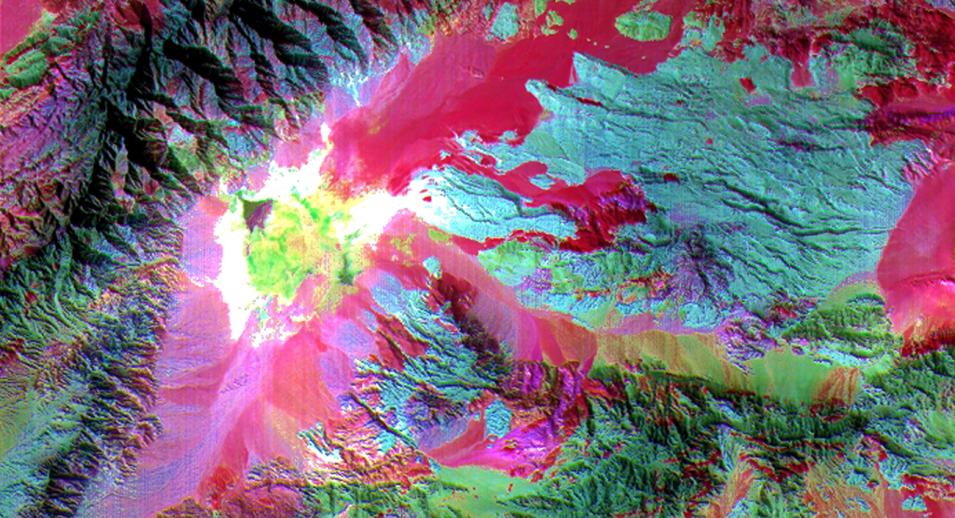
Infrared-sensing instruments aboard satellites orbiting Earth offer an incredible opportunity to quickly search large swaths of the planet for minerals and other materials. Different types of rocks, soil, and other substances absorb infrared energy in signature amounts and ways, making it possible to identify them from space. Terra’s ASTER sensor captured this infrared image of Saline Valley, CA, in 2000. Rocks with quartz content are colored red in the image; carbonate rocks are green, and mafic volcanic rocks, which have high proportions of magnesium and iron, are purple.
There are literally millions of additional examples of great infrared images and data available through NASA, all of which can be used fully and without restriction. Explore and access the expansive collections of infrared and other data by visiting Earthdata Search.

