Data More Powerful than Hurricanes

New ways of looking at data help storm forecasters and emergency managers solve challenges and prevent hurricane losses.

On the evening news, a graphic tells us that a new hurricane is forming: a little spiral cloud grows over a distant ocean. As days go by, it swells and wobbles towards land. At a distance, inlanders witness its landfall and aftermath. Meanwhile, coastal dwellers have time to get out of the way.

Science has not eliminated hurricanes, but scientific advances in the last fifty years have helped people survive them. Consider the story of the Category Four hurricane that struck Galveston in September 1900, still regarded as the deadliest hurricane in United States history.

Galveston meteorologist Isaac Cline could not have predicted the hurricane's path or fury in time to evacuate the city. From the rooftop of the Galveston weather bureau, Cline observed high tides and large swells first, then rapidly dropping barometric pressure just hours before landfall. The storm then certain, he waded home through waist-deep water. During the hurricane, Cline's house collapsed, and Cline and his two surviving children drifted on wreckage for three hours until the storm subsided. Fifty people took refuge in his house; only eighteen survived. The unnamed hurricane killed 6,000 of the city's 37,000 residents and flooded the entire city 7 feet deep.

Sadly, while life on the coast is safer now, Hurricane Katrina revealed how much must still be done to prevent suffering and death. Key questions need still sharper answers: Where is the storm going to hit? How strong is it? Who is in its path? What can be done to save lives? Researchers are looking more deeply into remote sensing and population data for these answers.

Forecasting hurricanes

Hurricane forecasters today are unlikely to be found monitoring conditions from the roof, as Cline had to do. Well-equipped storm centers digest data from spaceborne sensors, ocean buoys, and storm-chasing aircraft, enabling forecasters to see and understand storms still many days away. Methods continue to improve: three-day storm-track predictions are now as accurate as the two-day forecast was twenty years ago. But forecasters want to make similar progress in storm-intensity forecasts.

What do we gain from more accurate storm-intensity forecasts? At all points, more certainty supports better decisions. Uncertainty can stall people as they weigh storm risks against the physical hardships and costs of evacuation. A study of North Carolina coastal residents who were affected by Hurricane Bonnie in 1998 confirmed that most based their decision to evacuate on the forecasted severity of the storm. Despite mandatory evacuation orders, only one of every four residents and vacationers evacuated.

Particularly, forecasters want more data about wind intensity, a strong indicator of storm intensity and threat that has improved more slowly than storm-track forecasts. The best data about wind intensity for developing storms comes from sensors on ocean buoys and from storm-chasing aircraft that fly through the hurricane eyewall, where the most intense conditions occur. These measurements are then relayed to hurricane centers and used in storm forecast models.

But buoys and aircraft have limitations. Frank Monaldo, a researcher at Johns Hopkins University's Applied Physics Laboratory (APL), explained, "Aircraft measure wind speeds at altitude, not down on the ocean surface. And at higher wind intensities, you can't rely on the measurements from buoys. The buoy flops up and down and is shielded from the winds by waves, so you can't believe its data."

Monaldo and APL colleague Donald Thompson see promise in a new remote-sensing method for monitoring hurricane winds. Thompson said, "Weather satellites can show the familiar spiraling cloud-cover patterns that you see on television. But those dramatic cloud-top images aren't the whole story." Monaldo added, "If you had high-resolution wind data, you could look at the structure of the winds, and better understand the storm dynamics." Some remote-sensing instruments can measure winds, but do not provide enough detail for hurricane tracking.

So Monaldo and Thompson, teaming with other scientists and the National Oceanic and Atmospheric Administration (NOAA), have been studying Synthetic Aperture Radar (SAR) data, which has a resolution as fine as 100 meters (328 feet). SAR is better known for detecting sea ice, forest cover, and coastal erosion. The research team developed a method to retrieve wind speed from SAR data, using data from Canada's RADARSAT-1 instrument. The data are archived at NASA's Alaska Satellite Facility Distributed Active Archive Center (ASF DAAC) and distributed to U.S. researchers through a special agreement between the United States and Canada.
RADARSAT SAR
Image Caption

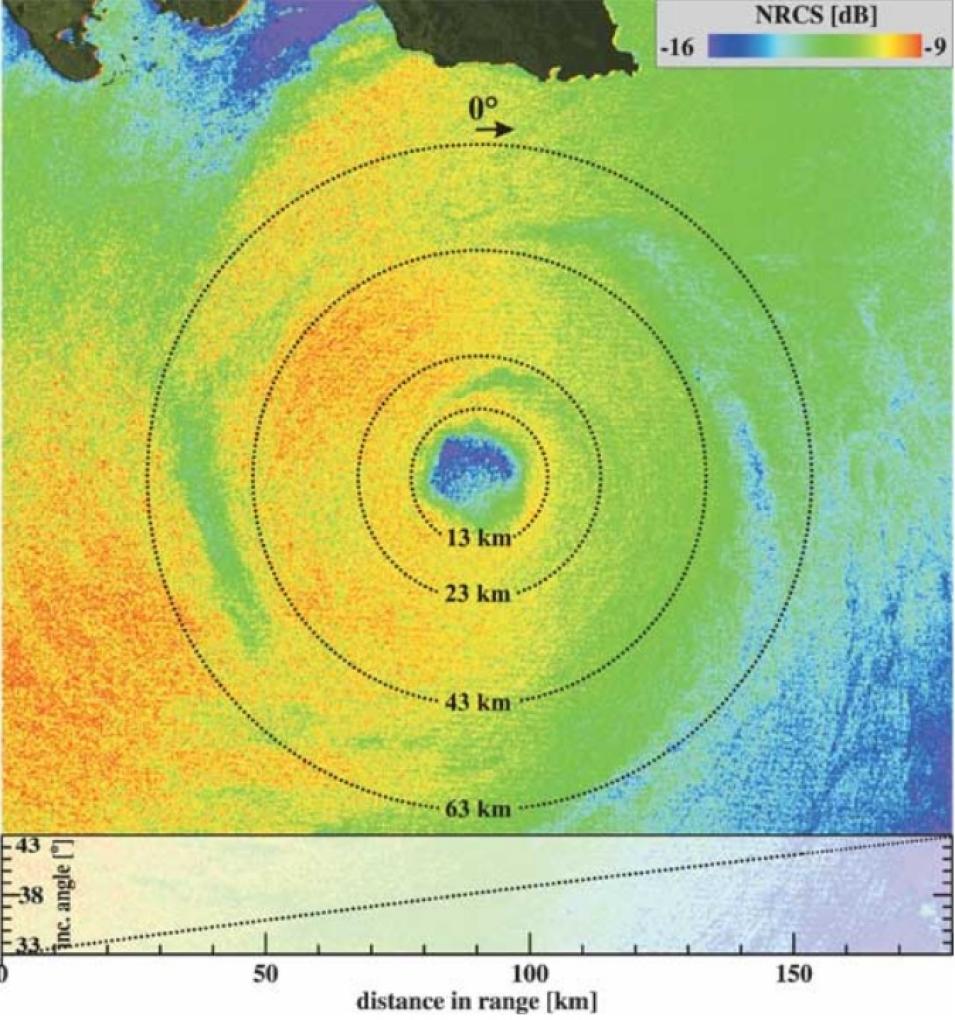
The Canadian RADARSAT-1 satellite captured this SAR image on September 10, 2004, showing the surface signature of Hurricane Ivan. (Courtesy GKSS Research Center and JHU APL; image processing by CSTARS, University of Miami)

Detecting hurricane winds

SAR microwave radar pulses can "see" the ocean surface day or night, in clear or cloudy conditions. SAR uses a special technique to synthesize a long antenna, providing much finer detail than normally possible from an instrument compact enough to ride on a satellite. Using this higher resolution, SAR can detect relatively small surface features. The highest-resolution images have been able to detect ships and their wakes, as well as surface waves, which are telltales of wind.

"The physics underlying the measurement of marine wind speed from space can be observed by a casual walk to a pond or lake," Monaldo said. "When no wind is present, the surface of the water is smooth, almost glass-like. As the wind begins to blow, surface waves begin to develop and the surface roughens. As the wind blows more strongly, the amplitude of the waves increases, roughening the surface still more."

Waves generated by winds have a high radar cross section, seen as bright areas in SAR images, because more of the radar signal is being bounced back. By studying SAR data on waves off the Alaskan coast and comparing the data to surface wind measurements, the researchers tuned their methods for detecting the wind signatures. Moving on to hurricane-force winds, the team then studied SAR images from Hurricane Ivan near Jamaica in September 2004, comparing the results to actual wind measurements from the storm, and to winds forecast by hurricane models. The SAR data agreed with the surface and model data for wind speeds up to approximately 120 knots (138 miles per hour).

More work is needed to refine this method, called the SAR inversion process, to accurately estimate the higher winds associated with hurricanes. Unlike a boat that leaves only a wake behind it, the circulating nature of a hurricane generates waves in all directions from its spiraling winds. Thus, the sea surface is much more "confused" in hurricane conditions than it is when the wind is blowing in a constant direction. Under such conditions, the wind direction becomes more difficult to extract from the SAR data. Thompson said, "Under hurricane conditions, the ocean surface is roughened not only by the local wind field, but also by long waves that were previously generated by the hurricane and that have traveled along to its current position. So the surface roughness depends not only on the local wind at that moment, but also on how strong the hurricane's winds were on its way there."

Another task is to make the wind data suitable for operational forecasting, which requires frequent updates. The team continues to seek ways to streamline data processing and thus be able to provide quicker snapshots of winds. "Because of the fine resolution of SAR, the data volume is quite large, so we can't process it instantly as it comes off of the instrument," Thompson said. "But at least for the Alaskan coastal winds project, we have it down to an hour from receiving the raw telemetry from the satellite, to posting wind data on the Web. We're currently working with the Center for Southeastern Tropical Advanced Remote Sensing (CSTARS) at the University of Miami to achieve a similar turnaround time for the SAR imagery that we expect to collect at CSTARS during the 2006 hurricane season." With continued research and refinement, the team hopes that SAR hurricane wind sensing will become a valuable part of the hurricane forecaster's toolkit in the near future.

Hurricane Katrina eyewall
Image Caption

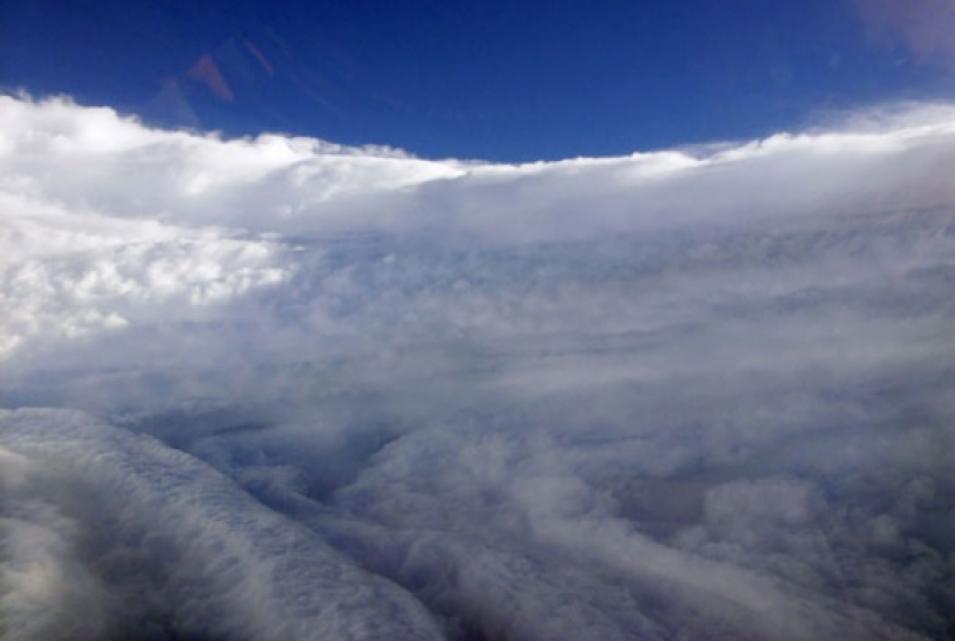
Hurricane Katrina's eyewall swirls in a photograph by a National Oceanic and Atmospheric Administration (NOAA) P-3 hurricane hunter pilot on August 28, 2005, a day before the powerful storm slammed into the United States Gulf Coast. (Photograph by Lieutenant Mike Silah/courtesy NOAA)

Preparing populations

Accurate and early hurricane forecasting translates into time for the communities in a storm's path: time to make appropriate preparations, such as stockpiling resources, securing structures, moving boats, and recommending evacuation. Such efforts call on a complex set of knowledge, resources, tools, and strategies.

Even had people in 1900 Galveston known what they faced, the town lacked the means to get people out of the way of a storm. Few people had telephones; storm warnings spread by word of mouth. Cars were rare, and roads unpaved. People took shelter the best they could, and those in the cheapest or most ramshackle structures suffered most. The city was completely unprepared. Afterwards, survivor John Bladgen wrote, "The more fortunate are doing all they can to aid the sufferers but it is impossible to care for all. There is not room in the buildings standing to shelter them all and hundreds pass the night on the street… The City is under military rule and the streets are patrolled by armed guards." No one had planned a response to a disaster of this magnitude.

Emergency management has since become a discipline, and experts seek to learn from past tragedies and anticipate the worst that might occur. Technology has brought helpful communication tools and transport. Still, emergency managers cannot take their success for granted. Hurricane Katrina dramatically illustrated the limits of evacuation orders and the continued reality of people failing to evacuate. Emergency managers have come to a greater understanding of the human and social issues that put people at risk.

Well before Hurricane Katrina devastated the Gulf Coast in August 2005, researchers from NASA's Socioeconomic Data and Applications Center (SEDAC), located at the Center for International Earth Science Information Network (CIESIN) at Columbia University, were working to make demographic information from the United States Census more useful and accessible to local emergency managers. Demographic data can reveal the "social vulnerability" of populations to a disaster. CIESIN researcher Lynn Seirup said, "How a disaster impacts a household can result from a complex set of circumstances, such as age, location, and economic factors. Census data gives us very specific information on who lives in an affected area and their needs before, during, and following a disaster."

Seirup, who worked in the New York City Office of Emergency Management before joining CIESIN, said, "Vulnerable populations are disadvantaged in each stage of the emergency management cycle--mitigation, preparation, response, and recovery--lacking some combination of time, money, health, knowledge, social capital, and political clout. Emergency managers need close-up, detailed statistics about the people in each neighborhood so that they can make the best plans at each stage of their disaster work."

The research team identified sixteen variables in the census data that may characterize vulnerable populations, their problems, and their needs. "The elderly may be reluctant to leave their homes unattended, or may fear sleeping in a large public shelter," Seirup said. "Knowing that you have populations with these concerns helps you address those concerns when you educate people about what to do."

United States Census data are freely available, but because of their format, the data can be difficult to integrate and compare with other data. SEDAC Project Scientist Deborah Balk said, "Social science data never come on a grid. Social scientists don't think in grids--they think in communities. Policy makers are at a county or state level, not at a grid or pixel level. But if you want to compare census data to geographic elevation, to see how many people are at risk from floods, for example, you need complementary data formats."

Gridded data have been evenly distributed, using uniform assumptions, across a grid of a defined geographical size. Gridding the data allows it to be easily overlaid on a map, and for additional variables to be overlaid as well, to create a more complete picture of the factors that might affect the area being studied. People with less computing power and expertise can analyze gridded data more quickly, over a much larger area, and in more detail.

New Orleans flood data
Image Caption

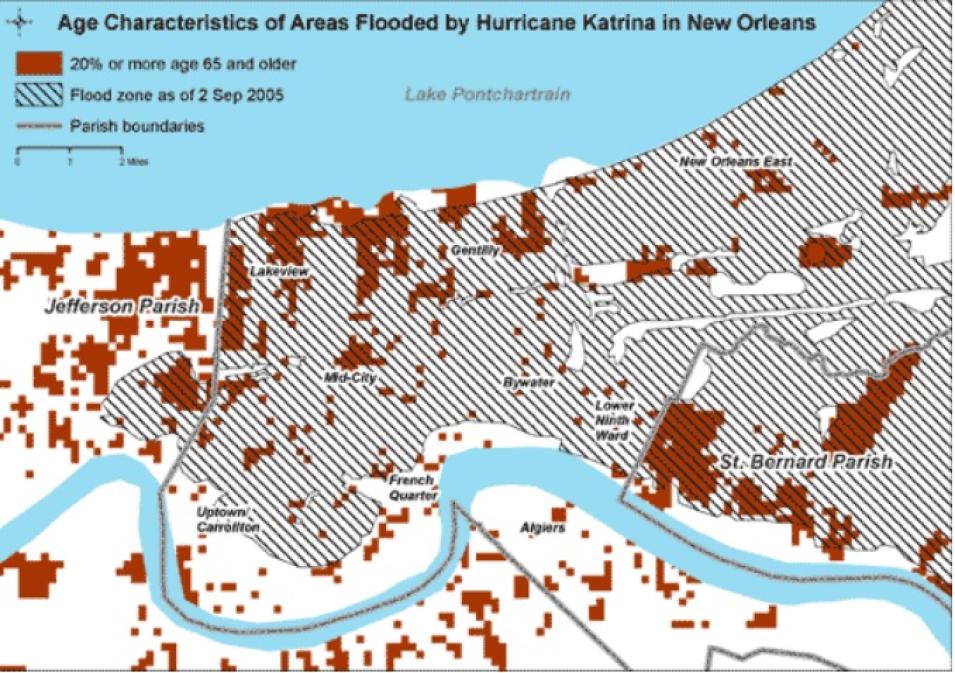
This map of New Orleans was compiled with flood data from Hurricane Katrina in September 2005, using SEDAC data on population age demographics from U.S. Census Grids, 2000 and flooding data from the Dartmouth Flood Observatory. (Courtesy CIESIN)

Using census data

This specific, uniform data about population characteristics supplements the local knowledge of emergency planners. Seirup said, "The local fire and police departments know who lives in their neighborhoods." The challenge is turning this qualitative knowledge into data for planning at a community level. "When I was an emergency manager in New York City, I knew that in one neighborhood that would be flooded by a Category One storm, 50 percent of the households had no one over age thirteen who spoke English," Seirup said. "But not every city has someone who would be able to work with raw census data, or the tools to do so."

Balk and Seirup first converted the census data to a grid, then further refined the data to match the needs of emergency managers. For most areas of the United States and Puerto Rico, a grid square of one kilometer (six-tenths of a mile) is sufficient. For the 50 urban areas of more than one million people, the team increased the resolution of the data down to a 250-meter grid square (820 feet). This finer resolution gives planners and responders much better data in cities with densely populated areas.

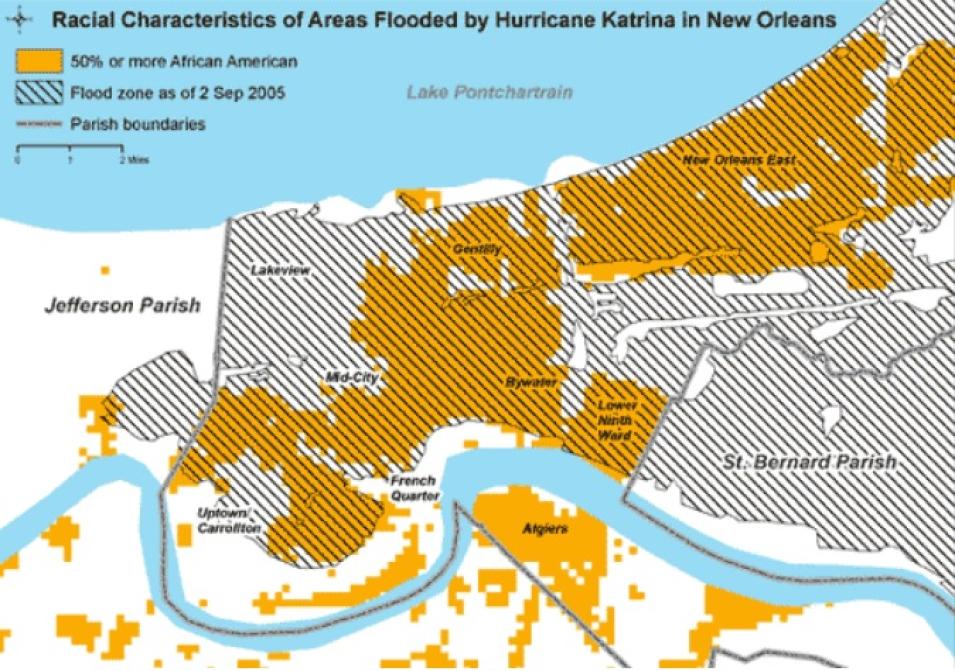
Hurricane Katrina's inundation of New Orleans offered a sad case study for social vulnerability. News coverage suggested that elderly and African American populations had suffered the most. Balk and Seirup applied the gridded census data to see if it could provide detailed information in the affected areas. Addressing questions such as "Who lived in the flooded areas?" and "Who was most likely to die?" Balk and Seirup analyzed the gridded census data. Integrating a map of the New Orleans area with the gridded census data and satellite imagery showing flooded areas, they found that in fact African Americans had been disproportionately affected, since more African Americans lived in the flooded parts of the city.

The researchers then obtained preliminary death statistics from Orleans Parish, the 180-square-mile parish that constitutes the city of New Orleans. Orleans Parish was 80 percent flooded after Katrina, and at least 555 people died there. The researchers were able to analyze the gridded census data and death statistics together; preliminary findings revealed disturbing facts. While only 12 percent of the parish population were age 65 or older, 67 percent of those who died were over 65. African Americans in Orleans Parish in every age group under age 65 also died at a higher rate; in all, they represented 77 percent of the under-65 population, but 82 percent of the deaths.

Saving lives

Balk and Seirup hope that in the future, the availability of gridded demographic data will help save lives, rather than confirm losses. Emergency planners could use demographic data to inform and tailor their plans for the unique needs of each area. The researchers also want to make census data more accessible and even easier to use. "We hope to develop a Web-based application so that people can view the data they need online, instead of needing to download files and work with them on their computers," Seirup said.

The researchers also plan to examine more case studies as new census data are released. "In the past, census data have been released every ten years," Seirup said. "Old data may not reflect the current population." Starting in 2005, the Census Bureau will release data more often, and will issue special releases for New Orleans. "The demographics in New Orleans are changing rapidly as a result of the storm and displacement of the population. It's even more important to have this detailed information on who's now living in the New Orleans area," Seirup said.

At CIESIN, researchers have also analyzed low-elevation coastal zones and population, using gridded census data from low-lying regions in countries such as Indonesia, Vietnam, and India, as well as the United States. Balk said, "A significant percentage of the U.S. population lives near the coast." Approximately 2.4 percent of the U.S. total population, and 6.3 percent of the U.S. urban population, live at below 10 meters elevation (32 feet), an elevation prone to flooding from both tropical storm surge and rising river delta waters from heavy rainfalls upstream. The analyses have drawn attention to risks in low-lying areas that have been poorly understood. The researchers are repeating the analyses by state, including the additional census variables that indicate social vulnerability.

We can be certain that hurricanes will continue to occur, although no one can predict exactly when and where the next major hurricane will make landfall in a highly populated and socially vulnerable area. After the next major hurricane, forecasters and planners hope to look back on Hurricane Katrina, much as we now look back on the 1900 Galveston hurricane, and see that new understandings of storm intensity and human issues have indeed saved people's lives.

New Orleans flood demographics
Image Caption

This map of New Orleans shows flooding and racial demographics in September 2005 following Hurricane Katrina. African Americans were 67 percent of the total population of New Orleans, but 75 percent of the population in the flooded areas. This map was compiled using SEDAC demographic data from U.S. Census Grids, 2000, and flooding data from the Dartmouth Flood Observatory. (Courtesy Lynn Seirup/CIESIN)

References

The 1900 storm: Galveston Island, Texas. Galveston County Daily News. Accessed April 4, 2006.

About SAR. University of Fairbanks: Alaska Satellite Facility. Accessed April 4, 2006.

Hurricane preparedness: Forecast process. National Hurricane Center. Accessed May 19, 2006.

NOAA history: Galveston storm of 1900. National Oceanographic and Atmospheric Administration. Accessed April 15, 2006.

Horstmann, J., D. R. Thompson, F. M. Monaldo, and H. C. Graber. 2005. Can synthetic aperture radars be used to estimate hurricane force winds? Geophysical Research Letters 32, L22801, doi:10.1029/2005GL023992.

Seirup, L. and D. Balk. "In harm's way: Learning about social vulnerability from Katrina." Presentation at the Association of American Geographers Annual Meeting, March 8, 2006.

Whitehead, John C. 2000. One million dollars a mile? The opportunity costs of hurricane evacuation. Greenville, NC: East Carolina University working papers.

For more information

NASA Alaska Satellite Facility Distributed Active Archive Center (ASF DAAC)

NASA Socioeconomic Data and Applications Center (SEDAC)

Synthetic Aperture Radar (SAR) wind imagery from Johns Hopkins University Applied Physics Laboratory

The Johns Hopkins University Applied Physics Laboratory (JHU APL)

Center for Southeastern Tropical Advanced Remote Sensing (CSTARS)

U.S Census Grids

About the remote sensing data used
Satellite RADARSAT-1
Sensor Synthetic Aperture Radar (SAR)
Data set RADARSAT Standard SAR
Resolution 100 meters
Tile size 100 square kilometers
Parameter Wind speed
DAAC NASA Alaska Satellite Facility Distributed Active Archive Center (ASF DAAC)
About the census data used
Data sets U.S. Census Grids
Resolution 250 square meters (metropolitan area data) 1 square kilometer (country/state data)
Parameters Individuals: age distribution, race, ethnicity, income, poverty, educational level, and immigrant status Households: household size, one-person households, female-headed households with children under 18, and linguistically isolated households Housing units: occupancy, seasonal usage, occupied housing units without a vehicle, and year of construction
DAAC NASA Socioeconomic Data and Applications Center (SEDAC)

Details

Last Updated

Published

Data Center/Project

Alaska Satellite Facility DAAC (ASF DAAC)
Socioeconomic Data and Applications Center (SEDAC)