image of CAMEX-3 project data

CAMEX-3

Convection and Moisture Experiment 3

The Convection and Moisture Experiment (CAMEX) is a series of field research investigations that studied atmospheric water vapor and precipitation processes using a unique array of aircraft, balloon, and land-based remote sensors. The first two CAMEX field studies were conducted at Wallops Island, Virginia, during 1993 and 1995.

The third field campaign in the CAMEX series, CAMEX-3, successfully studied Hurricanes Bonnie, Danielle, Earl, and Georges. CAMEX-3 collected data for research in tropical cyclone development, tracking, intensification, and landfalling impacts using NASA-funded aircraft and surface remote sensing instrumentation.

CAMEX-3 yielded high-resolution spatial and temporal data on hurricane structure, dynamics, and motion. These data, when analyzed within the context of more traditional aircraft, satellite, and ground-based radar observations, are providing additional insight to hurricane modelers and forecasters who continually strive to improve hurricane predictions.

The CAMEX-3 field campaign was devoted to the study of hurricane tracking and intensification using NASA-funded aircraft with remote sensing instrumentation. The NASA ER-2 and DC-8 were utilized along with the University of North Dakota’s Cessna Citation II Research Aircraft.

The remote sensing instrumentation used by NASA during CAMEX-3 yielded high-resolution spatial and temporal information on hurricane structure, dynamics, and motion. These data, analyzed within the context of more traditional aircraft, satellite, and ground-based radar observations, provided additional insight to hurricane modelers and forecasters who continually strive to improve hurricane predictions. The ultimate goal of CAMEX-3 was to provide information which could someday assist in decreasing the size of coastal evacuation areas and increasing the warning time for those areas.

Study DatesAugust - September, 1998
RegionAtlantic coast
Phenomena StudiedHurricane tracking and intensification

ER-2 Instruments - Characteristics

Instrument 
Acronym
Instrument TypeTemporal ResolutionSpatial ResolutionData Vol/Mission
AMPRScanning radiometer (10, 19, 37, 85 GHz)One 50-element scan every 3 seconds0.6 km at 85 GHz; 1.5 km at 37 GHz; 2.8 km at 10 19 GHz, (surface footprint)20-30 MB
EDOPDoppler Radar2 Hz rate. (~100m along-track)Vertical: 37.5 m; Horizontal: ~1.1 km at surface and ~0.55 km at 10 km~3.5 GB
LIPElectric Field Mills, Conductivity probe10 Hz, continuous~20m30-50 MB
MAMSScanning visible/IR sensor Continuous100 m, at nadir (surface)~1 GB
MASScanning spectrometerContinuous50 m, at nadir5-10 GB
MIRScanning radiometer (89, 150, 183, 220, 325 GHz)One scan cycle every 3 seconds~1-2 km at surface20-25 MB
NAST-IScanning interferometerContinuous2.5 km at nadir5-10 GB
NAST-MTSPassive microwave radiometerscontinuous scan, 6 sec period, 120 msec nominal integration time for raw data2.6 km from 20-km altitude at nadir< 100 MB

ER-2 Instruments - Science Objectives

Instrument 
Acronym
General HurricaneLandfalling HurricaneTRMM Science Cal/ValAlternate Science
AMPRConvection/storm intensity, relationships, eye wall structures, rain mappingRain mapping, changes of convection in landfalling storms; relationship of electrification to signal storm intensity changesValidation of TMI TB and rain algorithmsUnderflights of SSM/I and TMI
EDOPStorm dynamics, eye wall structures, storm microphysicsSee AMPR descriptionVertical storm structure, validation of algorithms and PR vertical structure-
LIPConvection/Storm intensity relationships, eye wall structure, rain mapping, relationships of lightning/electrification to storm dynamics/microphysicsSee AMPR descriptionCAL/VAL: validation of LIS and rain algorithmsValidation of Optical Transient Detector (OTD)
MAMSUpper tropospheric humidity, water vapor and SST-Validations of VIRSValidation of MODIS 6 micron channel
MASCloud microphysics at high resolution--Cal/Val of MODIS on cross calibrations with NAST
MIRWater vapor profiles, ice water pathSee AMPR description-NOAA-K and DMSP underflights
NAST-IThermodynamic structure, eye subsidence/warm core, surface heat flux relationshipsThermal gradient, wind steeringPrecipitation height from microwave validationNOAA-K validation, AIRS spectroscopy and algorithm validation
NAST-MTS    

ER-2 Instruments - Products

Instrument Acronym Direct ProductsPI-Derived ProductsPotential Products
AMPR

Raster TB imagery; 

In-field: Calibrated TB

Lat/Lon gridded TB imageryPrecipitation rate, hydrometeor profiles
EDOPReflectivity, doppler velocity; 
In-field: Uncalibrated reflectivities & velocity for selected flights
Attenuation corrected reflectivity, hydrometeor vertical motionsVertical velocities, horizontal flow, rainrate, path attention, surface backscatter cross section, air flow streamlines
LIP

Atmospheric conductivity, eletric field components, and aircraft charge


In-field: Quick looks at direct products


Total lightning count and rates; lightning statistics; storm current output, storm charge structureQuantified lightning related with precipitation, convective mass/ice flux, latent heat, storm current output
MAMS

Calibrated brightness temperature (IR) and radiance (Vis); 

In-field: Vis/IR images and line plots of nadir brightness temperatures

Total column water vapor; sea/land surface temperatureCloud top height and temperature
MAS

Calibrated brightness temperatures (IR bands) and radiances, sub-sampled imagery; 

In-field: MAS quick look

Cloud particle phase, cloud height, cloud maskAerosol optical depth, cloud reflectance, precipitable water
MIR

Calibrated brightness temperatures, raster brightness images; 

In-field: water vapor profiles if temperature profiles available and brightness temperature images

Water vapor profiles (require temperature profiles)-
NAST-ICalibrated brightness temperature spectra IRAtmospheric soundings, ocean surface temperatures, precipitation cell height, cloud height/radiative properties, cloud microphysical propertiesCloud properties
NAST-MTSmicrowave brightness temperaturesInterpolated, microwave-only, clear-air temperature retrievalsMicrowave-Infrared combined temperature and humidity and retrievals with cloud corrections.

ER-2 Instruments - Planning Needs

Instrument AcronymCritical Science Data Mission Planning Data NeedsIn-field Products
AMPRLIP, sondes, VIS/IR, passive microwave, radar, rain gage, microphysicalGOES, SSM/I, WWW access.Calibrated TB images
EDOPLIP, sondes, VIS/IR, passive microwave, radar, rain gage, microphysicalGOES, WSR-88D, NIDS, Web accessUncalibrated reflectivities and velocity data for select periods of flight
LIPPassive microwave, TRMM obs, NLDN/KFC lighting, radarWSR-88D, GOES, NLDN, LDAR, RDI, TRMM, OTD, SSMI, satellite orbit predictionsElectric fields (and  
perhaps lightning)
MAMSEHAD, LASE, MIR, GOES-VIS/IR images, Line plots of nadir TB
MASNAST-I, NAST-MTS, in situ microphysical MODISEOS-AM1 overpass informationMAS quick-look
MIREHAD, RAOB, MTS, NAST-MTS, HIS, lidar, radar-TB images, (Water vapor profiles if temp. profiles avail.)
NAST-IMIR, MAS/MAMS, dropsondes, GOES, NOAA-KGOESSST
NAST-MTSNAST-I, radiometers (MIR, AMPR), radiosondesTBDRaw data imagery, video images

ER-2 Instruments - Aircraft Maneuvers

Instrument 
Acronym
Preferred ManeuversDropsondesUnfavorable ManeuversUnfavorable WX  
Conditions
AMPRClear ocean level flight track for 5 minutes > 20 km altitude at start and end of missionTwo/flight. One at each preferred manueverNon-level flight track. Require pitch/roll angle < 2 deg. with minimal variations-
EDOPRoll manuever of -5 to +5 degs. over ocean; 360 deg. turn at 7-10 deg. bank angle over clean oceanFive per flight; some in or near eye wall; inner core and outflow regionsNon-level flight track. Require minimal pitch/roll/yaw-
LIPLevel flight at 5, 10, 15 km for 10 minutes each once during the experiment---
MAMS-2-3 per flight, 1 per hour, primarily clear skyRoll angle > 15 degreesClouds
MASStraight and level flight1-2 per flight in clear and transmissive cloud conditionsRoll angle > 3 deg.; pitch angle > 2 deg.Intense sunlight
MIR-2-4 per flight over clear targets--
NAST-ILevel flight, tracks over downwind environment, tracks across eye, flight over Andros Island1-5 per flightRoll ange > 3 deg., pitch angle > 2 deg.-
NAST-MTS- --


DC-8 Instruments - Characteristics 

Instrument AcronymInstrument TypeTemporal ResolutionSpatial ResolutionData Vol/Mission
AMMRRadiometer (fixed) 
10-92 GHz 
45 deg upview: 21 and 37 GHz 
Nadir view: 18 and 37 GHz 
1 second~1-2 km @ surface 
ARMARDoppler radar (13.8 GHz) 
(Thru-nadir scanning) 
(multi-polarization) 
1.8 seconds/scan 
10 MHz sample rate 
5 kHz PRF
800 m at surface, 
80 m range resolution (after averaging)
> 10 GB (raw), 200-600 MB (processed) 
AVAPSNCAR/GPS sondeSystem can track 4 sondes simultaneously10 m (vertical)<50 KB per sonde release 
CAPACFSSP300 aerosol/cloud partice spectrometer; 2D-Cloudprobe; 2D-Precipitation probe; 2D-Greyscale probe; Cloudscope.1 Hz2 km (at 200 m/sec aircraft speed)< 1 GB
JPL SAWMicrohygrometerTBD (up to 0.1 sec)Single point measurement10 MB
Laser Hygrometerdiode laser spectrometernominally 1 sec @ 10Hz, minimum .128 sec @ 8Hz.Dependent on sampling rate. 25 meters minimum.500 KB
LASEDifferential Absorption Lidar3 seconds per profile; 
2 min. (averaged)
Water profiles: 0.2 km (vert.), 5 km (horiz.), 100 m to tropopause 
Relative aerosol scattering profiles: 30 m (vert.), 200 m (horiz.), ground to 20 km 
200 MB
MACAWSDoppler lidar (side-scanning)Depends on pulse repetition frequency, scanning pattern, signal processing parametersHorizontal coverage 2-30 km; Horizontal resolution: Line of Sight winds 150-450m, Calculated wind vectors 1-3 km; 
Vertical coverage 4.2-10 km 
500 MB
MMSRosemount probesup to 5-Hz40-m at 200 m/s airspeedpreliminary field data: 2-Mbyte
high resolution data: 25-Mbyte
PSRPassive microwave radiometerComplete conical scan each 10 seconds, independent radiometric samples every 25 msec.2.5x5 km footprints at 10.7 & 18.7 Ghz, 12 km altitude; 0.8x1.3 km footprints at 37& 89 Ghz, 12 km altitude;30 Mbytes [raw data]

DC-8 Instruments - Science Objectives

Instrument AcronymGeneral HurricaneLandfalling HurricaneTRMM Science Cal/ValAlternate Science
AMMR    
ARMARVertical velocity studies;  
Eyewall structure
 Precipitation radar validation studies (clear air and rain);  
Rain type classification; 
Beamfilling studies
 
AVAPSIncremental observational resolution of hurricane dynamic and thermodynamic structureImpact of adaptive observations on intensification and tracking forecastsInput to radiative transfer modelsCAMEX-3 sensor validations
CAPACCloud particle size distributions and condensate mass Condensate mass to compare w/ remotely sensed values 
JPL SAW    
Laser Hygrometer    
LASECharacterize hurricane environment using water vapor, aerosol, & cloud measurements; Input to models & assimilation schemes; Fill in sonde data voids   
LIPConvection/Storm intensity relationships, eye wall structure, rain mapping, relationships of lightning/electrification to storm dynamics/microphysicsRain mapping; changes of convection in; landfalling storms; relationship of electrification to; signal storm intensity changes CAL/VAL: Validation of LIS and rain algorithmsValidation of Optical Transient Detector (OTD)
MACAWSEyewall dynamics, role of low-level inflow in rapid intensificationImpact of lidar adaptive observation on intensification & tracking forecastsRelationship between wind environment and deep convectionNear-sea surface wind comparison w/ scatterometers; Satellite Doppler wind lidar performance simulations (incl. SPARCLE); Aerosol backscatter  validation w/ MSFC Continuous Wave lidar; Angular dependence of sea surface scattering
MMS    
PSRImage precipitation bands and surface winds around eyewall; improve algorithms for wind, cloud, and rain retrieval; study high-resolution polarimetric signature structure within rain bands.Improve passive microwave precipitation retrieval algorithms for near-shore areas;Compare colocated TRMM/PSR polarimetric signals for consistency; study beam-filling effects using high-resolution passive microwave imagery; compare retrieved PSR products to peak TRMM products to determine level of bias in extreme parameter regions. Compare PSR raw observations and retrieved products with those of TMI and SSM/I.Obtain first high-resolution multiband polarimetric conically-scanned imagery over strong convection and winds.

DC-8 Instruments - Products

Instrument AcronymDirect ProductsP.I. Derived ProductsPotential Products
AMMRCalibrated TB (18-37 GHz)Water vapor profiles (requires temperature profiles) 
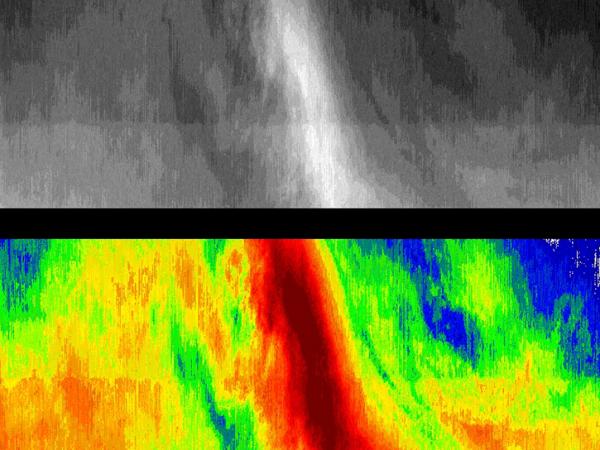
ARMARIn-field: Equiv. reflectivity factor Ze, Doppler velocity, Cross-polarization reflectivity,  
HH-VV correlation coefficient,  
HH-VV phase difference 
Rain rate,  
Updraft velocity,  
Latent heating
Rain rate,  
Updraft velocity,  
Latent heating
AVAPSProfiles of temperature, pressure, humidity, and wind velocity  
CAPACIn situ particle density, size, and shape (few um to 1.6 mm for 1st and 4th instrument; 0.2 um to 20 um for 2nd and 3rd instrument). 
In-field: above for a few periods
Cloud/aerosol part. size distrib. (0.2 um<D<1.6mm, Diameter);  
Condensed water volume
 
JPL SAWIn situ dewpoint/frostpoint, pressure, temperature (raw data).  
In-field: plots of dewpoint/frostpoint
In situ dewpoint/frostpoint, pressure, temperature (formatted data) 
Laser HygrometerIn-situ water vapor volume mixing ratio along the DC-8 flight track intercomparisons with the other water vapor sensors on the DC-8; water vapor data will be utilized by the lidar teams and the modelling teams to define atmospheric conditions and analyze atmospheric dynamics
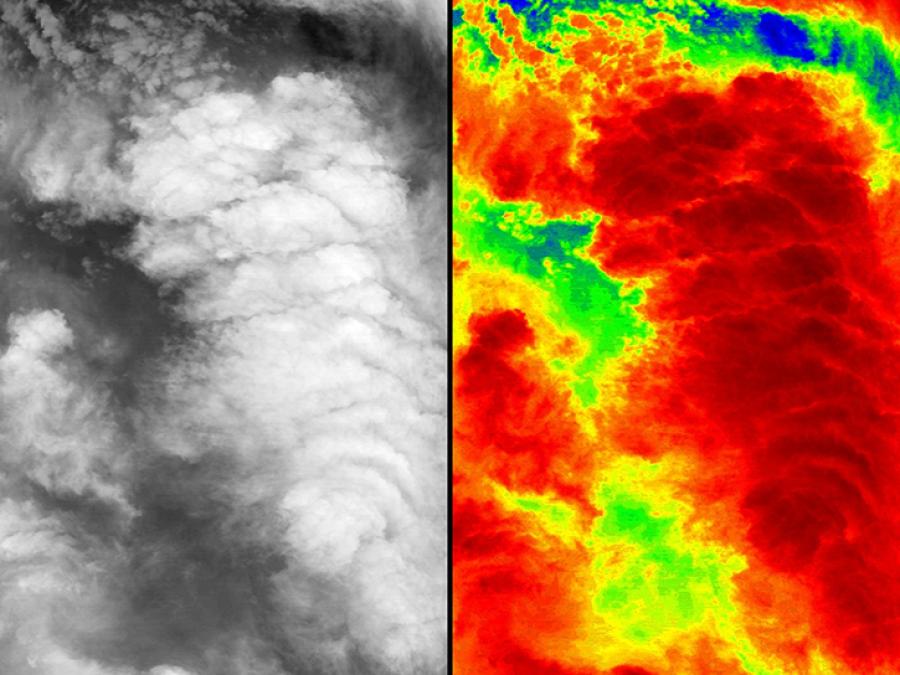
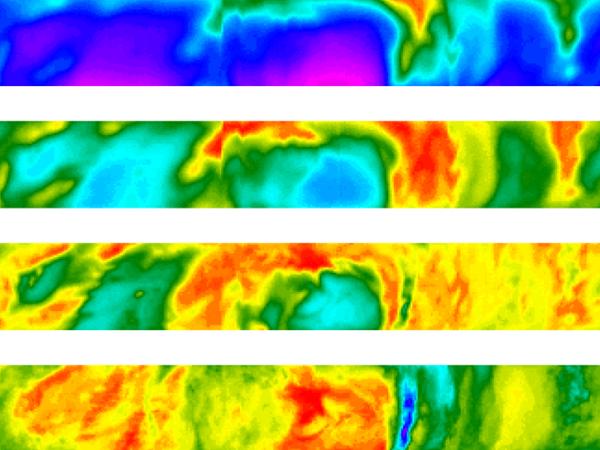
LASEProfiles of water vapor mixing ratio and aerosol scattering.  
In-field: Color images of water vapor mixing ratio & relative aerosol scatttering cross sections
Cross sections of water vapor mixing ratios, relative humidities, total atmosphere scattering ratios, and aerosol backscattering coefficientsTotal precipitation water; Aerosol extinct. profiles; Aerosol optical thickness; Cloud base/top height; Relative humidity profiles; Boundary layer height
LIPElectric field components, aircraft charge. 
In-field: Quick looks at direct products
Total lightning count & rates, lightning statistics, storm current output, storm charge structure (last two in conjunction with ER-2 measurements)Quantified Lightning; relationship with precipitation; convective mass/ice; flux, latent heat; storm current output
MACAWSLOS wind velocities and relative backscatter as a function of location, range from aircraft, elevation angle, & azimuth angle.  
In-field: LOS velocity and relative backscatter with respect to time/height
Selected 2-D wind fields as a function of elevation angle with respect to aircraft2D wind fields, kinematic quantities, fluxes, Richardson number
MMS1-Hz data: time, pressure, temperature, theta horizontal wind (U,V), vertical wind (W), turbulence index
5-sec data: latitude, longitude, pressure-altitude, true-air-speed
  
PSRPolarimetric, multiband, fore/aft conically scanned, and geolocated brightness temperature mapsSurface wind speed and wind direction, integrated cloud water content, near surface rain rate.Improved P.I. derived products using rain radar data and integrated water vapor data.

DC-8 Instruments - Planning Needs

Instrument AcronymCritical Science DataMission Planning Data NeedsIn-field Products
AMMR   
ARMARRadiometer,  
Other aircraft radars,  
Ground-based radars,  
Aircraft microphysics
Satellite VIS/IR,  
Ground-based radar
Reflectivity images
AVAPSGPS constellation telemetry  
CAPACMMS and DADS data Time series of particle number, volume, and surface area, Size distribution @ particle shapes for a few selected time periods 
JPL SAW  Time series plots of dewpoint/frostpoint 
Laser HygrometerPressure and Temperature from MMS (or equivalent) Comparisons with other H2O sensors are valuablePressure and Temperaturewater vapor volume mixing ratio. Preliminary data within 1-23 hours of flight termination provided pressure and temperature data are available from MMS
LASEDropsonde winds & temperature; 
Scanning HIS temperature crosssections
GOES Imagery;  
Radar precipitation imagery;  
General meteorological observations;  
Hurricane forecasts
Color images of water vapor mixing ratio & relative aerosol scattering cross sections
LIP WSR-88D, GOES; NLDN, LDAR, RDI; TRMM,OTD,SSM/I; satellite orbit; predictionsElectric fields and conductivity (perhaps lightning statistics)
MACAWSMSFC Continuous Wave lidarHurricane intensity & tracking forecasts;  
VIS/IR/WV satellite images;  
Hurricane recon. observations
Line of Sight velocity time/height cross-section images, Selected 2-D wind field images Time/height cross-section images of relative backscatter
MMS   
PSRParticle size measurements, ARMAR radar data. SSM/I data, RADARSAT data; GOES IR imageryWeather FAX on board DC-8 to provide near real-time picture of conditions.Maps of wind speed and direction, surface rain rate, and cloud liquid water.

DC-8 Instruments - Aircraft Maneuvers

Instrument AcronymPreferred ManeuversDropsondesUnfavorable ManeuversUnfavorable WX Conditions
ARMARLevel flight lines; Some banking desiredOne near data collection area (no rain/light rain)  
AVAPS  Sharp turnsHeavy rain, large hydrometeors
CAPAC  Steep (>1000 feet per minute) descents and ascents 
JPL SAW  Rapid descent from cold, dry conditions to warm, humid conditionsRain
Laser Hygrometer  Sharp turns may affect optical alignment.Rain on ground
LASEModerate to high altitude (> 25 kft) Attitudes where zenith port axis is < 15 deg. relative to sunClouds (data collected between aircraft & clouds)
LIPStraight, level flight paths; 
1-2 Banking maneuvers required per experiment for calibration
   
MACAWSStraight lines at constant altitudes of 1000 - 41000 ft; Spiral ascents/descents in optically-clear eye; Orbits of 5-30 km diameter over a ground point1-2 per mission in relatively clear areaFrequent changes in heading or altitude; Exceeding ground speed of 450 kt; Drift angle < 10 degreesOptically-dense clouds, precipitation, extremely clean air
MMSFive sinusoidal pitching cycles, five sinusoidal yawing cycles, and square box pattern spanning 0-360 deg of heading. Once per flight in "calm" air at a specific MACH number for instrument calibration  cold wet cloud encounters
PSRStraight and level flight at altitudes between 30,000' and 45,000' from at least two different non-orthogonal flight directions Brief 60o left rolls3-5 per missionNoneNone

Ground-Based Instruments - Characteristics

Instrument AcronymInstrument TypeTemporal ResolutionSpatial ResolutionData Vol/Mission
AERIInterferometer10 minutes<300 m for z <3 km at 1.7 degree full angle zenith view< 5 MB
RadiosondeRadiosonde2 seconds~10 m-
SRLScanning Lidar30-60 seconds10-300 m10 - 20 MB

Ground-Based Instruments - Scientific Objectives

Instrument Acronym General HurricaneLandfalling HurricaneTRMM Science Cal/ValAlternate Science
AERIPlanetary boundary layer ApplicableCERES surface budget validationSpectroscopy validation for AIRS/NOAA/GOES sounders
RadiosondeApplicableApplicableApplicableApplicable
SRLApplicableApplicableCal/Val science with TRMM communityCal/Val for CAMEX-3 water vapor sensors. Sub-tropical water vapor climatology.

Ground-Based Instruments - Products

Instrument AcronymDirect ProductsPI-Derived ProductsPotential Products
AERIPBL temperature and moisture profiles  
In-field: Downwelling spectral radiances
Boundary layer temperature and humidity profiles; Aerosol optical depth spectroscopic parametersInfrared aerosol optical depth
RadiosondeAtmospheric soundings of temperature, pressure, relative humidity, wind, altitudeAtmospheric soundings of temperature, pressure, relative humidity, wind, altitudeMixing ratio, specific humidities, thermodynamic properties
SRLVertical profiles of water vapor mixing ratio  
In-field: Images of water vapor, mixing ratio, aerosol scatter, or extinct. vs. alt and time
Mixing ratio, aerosol scattering, aerosol backscatter and extinction vs altitude; precipitable water vs time Relative humidity, precipitable water, optical thickness

Ground-Based Instruments - Planning Needs

Instrument AcronymCritical Science DataMission Planning Data NeedsIn-field Products
AERISRL, radiosonde NAST-I, LASEGOESDownwelling spectral radiances, planetary boundary layer temperature and moisture profiles 
Radiosondelidar, airborne in situ moisture and temperature data- 
SRLradiosonde, AERI, airborne instrumentsWWW accessImages of water vapor, mixing ratio, aerosol scattering or extinction vs. altitude and time, precipitation water vapor

Ground-Based Instruments - Aircraft Maneuvers

Instrument AcronymPreferred ManeuversDropsondesUnfavorable ManeuversUnfavorable Wx Conditions
AERIER-2 and DC-8 overflightsOne per flight: over the ground facility-Rain
Radiosonde---High surface winds, Excessive precipitation
SRLRegular overflights of the ground facilityOne per flight: over the ground facility-Rain

The following links provide additional information about CAMEX-3.

Hurricane Research and Updates

Current hurricane status and information.

Aircraft Operations

Information about the aircraft that fly around, through, and over hurricanes.

Hurricane Education

Informative facts, figures, tips, and trivia about hurricanes.