We are in the process of migrating all NASA Earth science data sites into Earthdata from now until end of 2026. Not all NASA Earth science data and resources will appear here until then. Thank you for your patience as we make this transition.
Read about the Web Unification Project
ESDIS Weekly Metrics: October 28, 2021
Note:
- The volume distributed to end users per day, as a running average over the last 4 weeks, is 3.1 times the volume added to the archive per day.
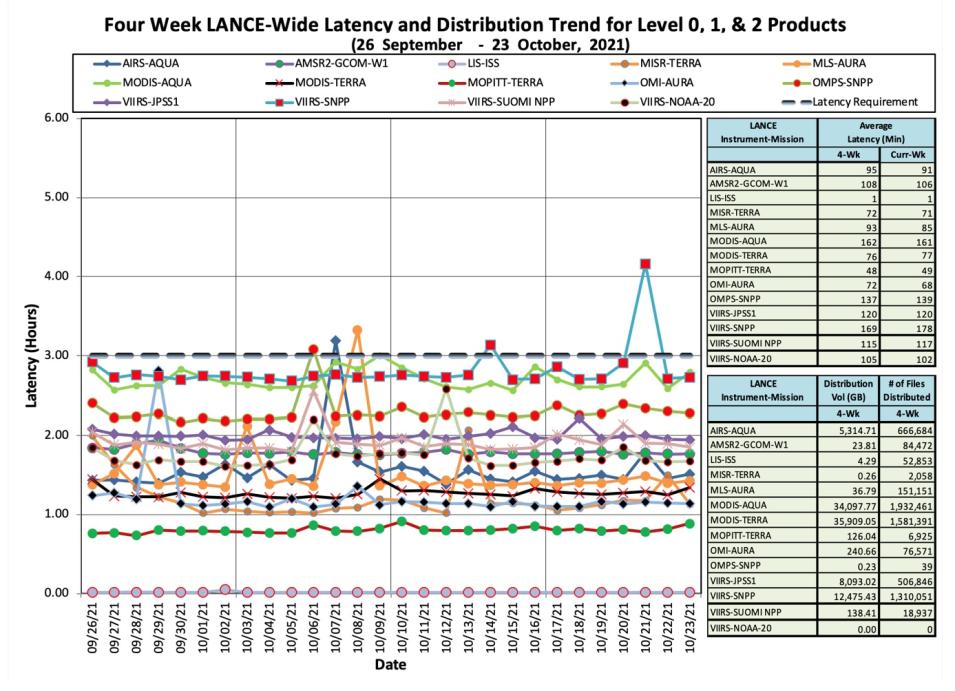
LANCE Data Latency
Note:
- Higher product latencies for VIIRS-Suomi NPP on 21 October 2021 are due to a failed geolocation granule causing a delay in downstream products, and since has been successfully fixed.
Note:
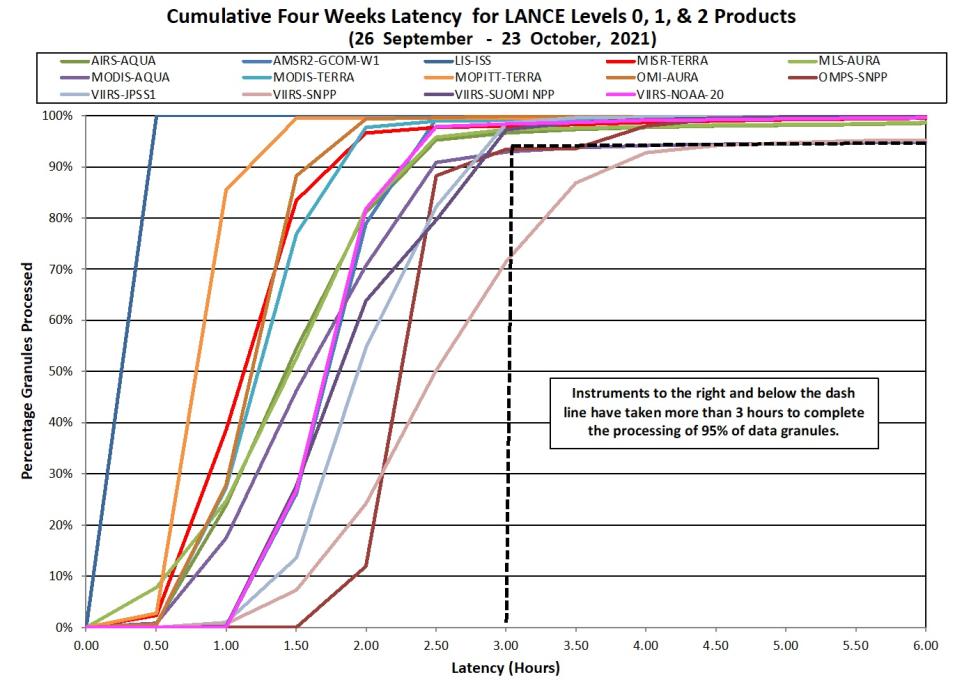
- Latency for a data granule is defined as the time taken from the midpoint between the start and end of acquisition of the data for that granule to the granule’s being ready on-line for users to download.
- Duration covered by the data for a granule is defined differently for different instruments (e.g., MODIS granules are 5 minutes long while OMI NRT granules are 13 to 136 minutes long).
- Over the last four weeks, over 95% of NRT data requests for all instruments except for three instruments (MODIS-AQUA, OMPS-Suomi NPP and VIIRS-Suomi NPP (Land)) were satisfied within 3 hours. For MODIS-AQUA, OMPS-Suomi NPP and VIIRS-Suomi NPP (Land) over 93%, 93% and 72% of the NRT data requests were satisfied within 3 hours, respectively.
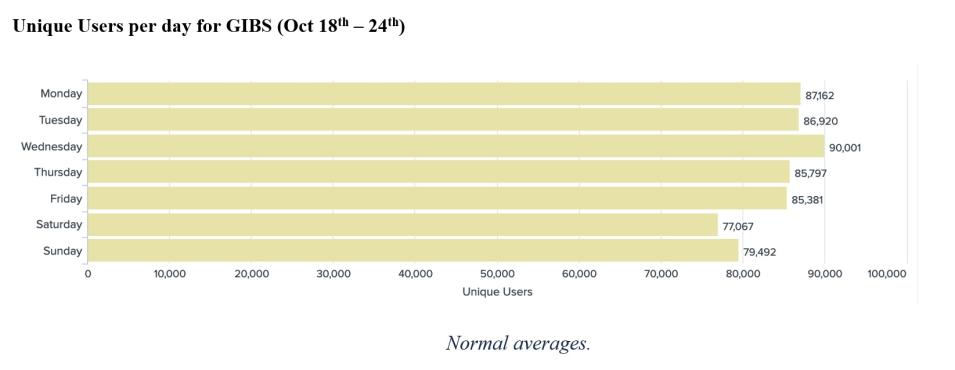
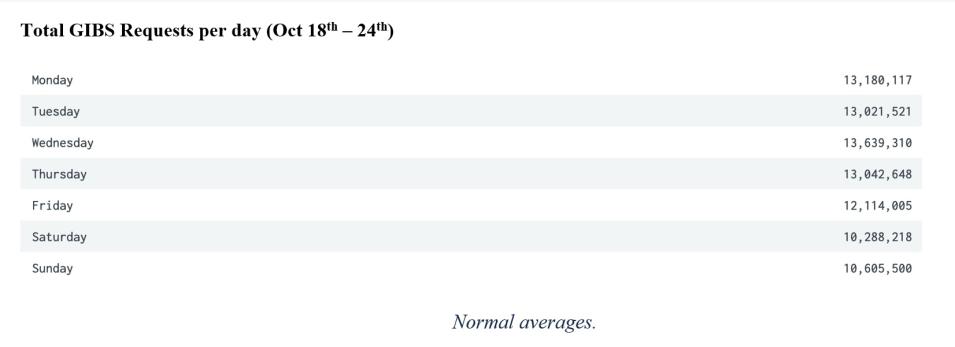
Global Imagery Browse Services (GIBS)
GIBS in the Cloud (GITC)
Worldview
Metrics from previous weeks are organized by week, and users can access the ESDIS Weekly Metrics Archive.

