New Dataset of Greenland Ice Sheet DEMs Available at NASA's PO.DAAC

A dataset with digital elevation models (DEMs) of the Greenland Ice Sheet is the latest release from NASA’s Oceans Melting Greenland (OMG) mission.
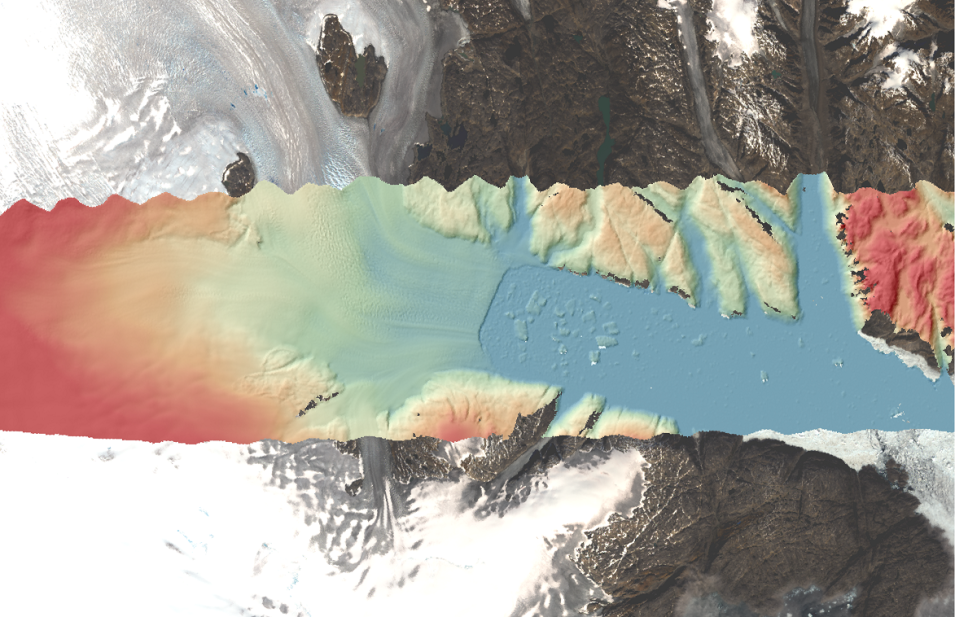
Multi-colored glacier image showing elevation change from left to right (west to east) with colors changing from red (left side, higher elevation) to blue (right side, low elevation/sea level).
Image Caption

Image created from OMG GLISTIN-A data showing the elevation of Helheim Glacier and Sermilik Fjord in southeast Greenland. The glacier flows from left to right (approximately west to east), from areas of high elevation (red) down to sea level (blue). The DEM is shaded by surface slope to highlight surface features revealed by elevation measurements: the crevassing and cracking of the glacier surface as it accelerates downstream, the calving front where the glacier meets the ocean, and the broken icebergs floating within the fjord. The fjord is bordered by mountains several hundred meters tall (orange and red), showing the vertical scale of the ice inland of Helheim glacier relative to sea level. The DEM is overlain on a ‘Natural Color’ Landsat 8 image. Click on image for larger view. Image Courtesy NASA/JPL-Caltech.

A new dataset with gridded digital elevation models (DEMs) of Greenland Ice Sheet outlet glaciers is available through NASA’s Physical Oceanography Distributed Active Archive Center (PO.DAAC). The dataset, OMG Glacial Elevations from GLISTIN-A Ver. 1 (DOI: 10.5067/OMGEV-GLNA1), is part of the Oceans Melting Greenland (OMG) mission and is created from data collected by the Glacier and Land Ice Surface Topography Interferometer-Airborne (GLISTIN-A) radar.

GLISTIN-A campaigns were performed in 2016, 2017, 2018, and 2019 using a NASA Gulfstream III jet aircraft to generate high-resolution, high-precision elevation measurements of Greenland’s coastal glaciers. GLISTIN-A is an airborne single-pass interferometric Ka-band radar that provides digital elevation maps of the glaciers and surrounding areas near the glacier’s termination points. This new dataset facilitates analysis of year-to-year glacier surface elevation changes, and the dataset’s 50-meter horizontal resolution DEMs can be used to quantify ice volume change near glacier termini. These data, along with observations of airborne marine gravity and ship-based observations of sea floor geometry, are part of a revolutionary dataset for modeling ocean/ice interactions for improved estimates of global sea level rise.
Triangular logo with point at bottom. Letters

Greenland’s ice sheet contains enough water to raise global sea levels by as much as 7.4 meters (25 feet), according to the OMG mission website. The objective of NASA’s five-year (2015-2020) OMG mission is to better understand the ocean’s role in melting Greenland’s glaciers. Using a combination of airborne, in situ, and seaborne resources, OMG is gathering data about water temperature and glaciers around Greenland to assess how fast the ice sheet is melting and how fast global sea levels will rise as a consequence of this melting.

PO.DAAC is NASA's Earth Observing System Data and Information System (EOSDIS) DAAC responsible for data and related information pertaining to the physical processes and conditions of the global oceans, including measurements of ocean winds, temperature, topography, salinity, circulation and currents, and sea ice. PO.DAAC is located at NASA’s Jet Propulsion Laboratory in Pasadena, California.

Learn More

OMG mission page: https://omg.jpl.nasa.gov

PO.DAAC OMG mission page: https://podaac.jpl.nasa.gov/OMG

Download GLISTIN-A data using PO.DAAC Drive: https://podaac-tools.jpl.nasa.gov/drive/files/allData/omg/L3/elevation/GLISTINA

Explore OMG mission data: https://omg.jpl.nasa.gov/portal/browse/

Details

Last Updated

Published

Data Center/Project

Physical Oceanography DAAC (PO.DAAC)