Satellite data comes onboard
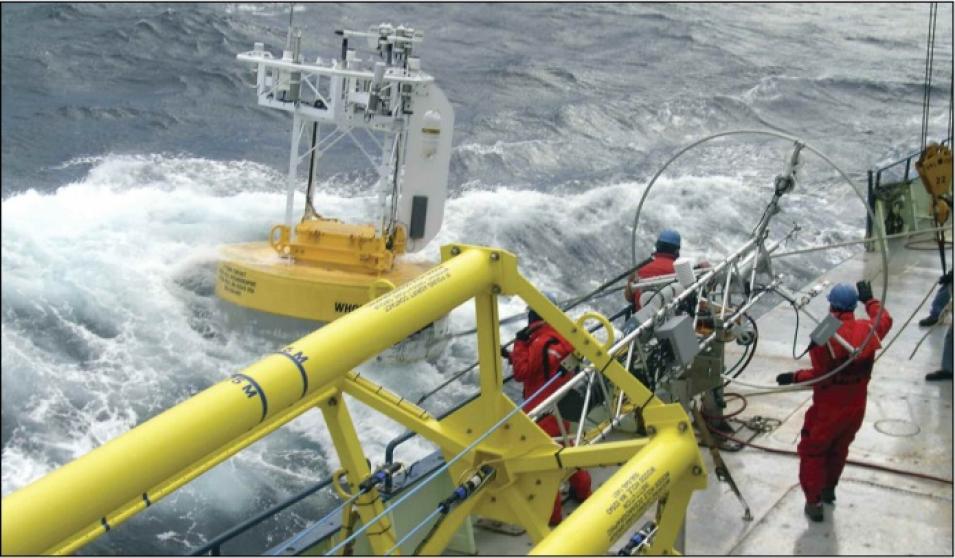
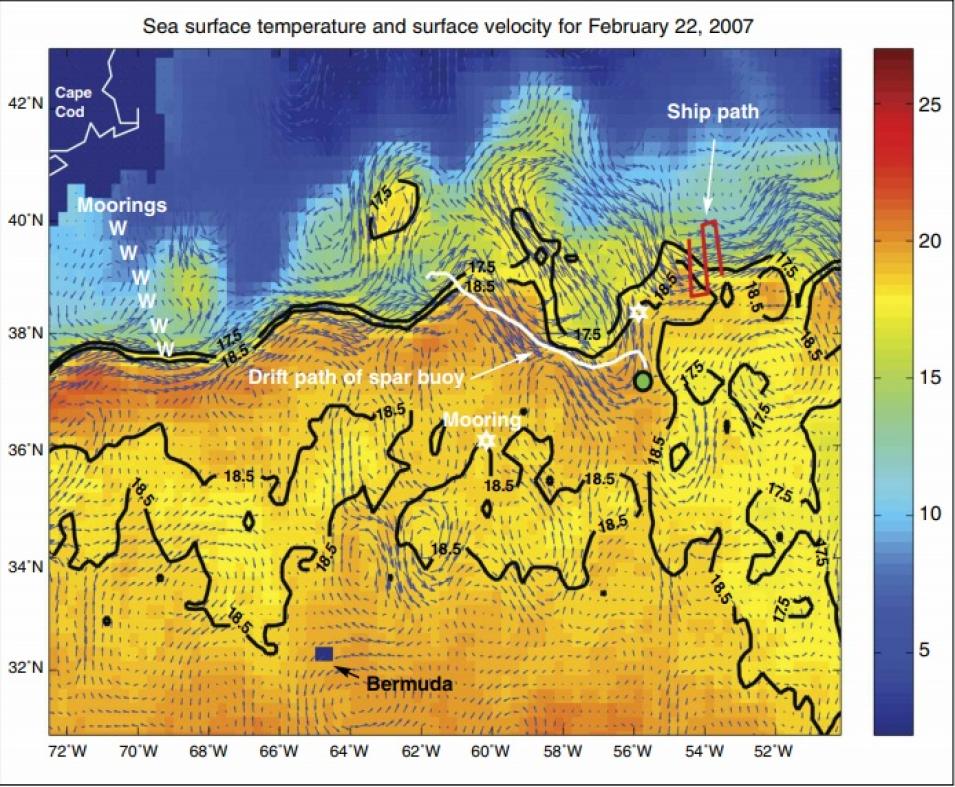
How did the crew aboard the R/V Knorr know exactly where to find the elusive mode water to deploy their instruments? Suzanne Dickinson, Kelly’s colleague and fellow oceanographer, worked closely with the crew while she stayed warm and dry on land. She said, “During the cruises, I uploaded daily satellite maps, based on sea surface temperature, to the ship.” Sea surface temperatures helped the shipboard scientists find the eighteen-degree water because it forms when the atmosphere strips off the overlying warmer water through heat exchange, allowing the cooler water to appear at the surface. The satellite data they used came from the Advanced Microwave Scanning Radiometer for Earth Observing System (AMSR-E), which flies on the NASA Aqua satellite. AMSR-E is a passive microwave instrument, so it was able to see through the winter clouds and provide data even during the all-too-frequent winter storms.
Dickinson retrieved the sea surface temperature data through a NASA project called “Distributed Information Services: Climate/Ocean Products and Visualization for Earth Research,” or DISCOVER. The goal of DISCOVER is to provide accurate long-term climate records and near-real-time ocean data products for scientists. Frank Wentz of Remote Sensing Systems, Inc., leads the DISCOVER team; NASA's Global Hydrology Resource Center Distributed Active Archive Center (GHRC DAAC) hosts the data for distribution in easy-to-use formats.
Joyce said, “The remote sensing information was invaluable. We’d wait for it daily and download it around two in the afternoon. We were working twelve-hour shifts day and night on the ship, so we tried to have a clear plan before we turned it over to the next shift.” By studying the broad coverage of the satellite maps, the crew was able to sail the ship to areas where mode water was forming to deploy their instruments.
Dickinson said, “In addition to the sea surface temperature data, we also sent QuikSCAT wind data, which helped the crew see what weather was coming, and altimeter data, which helped indicate currents.”
Gathering three types of data from various sources for five cruises spanning three years was not a simple task. Dickinson said, “Near-real-time data streaming doesn’t just happen all the time. Sometimes I’d look for the data and it wasn’t there—and I’d have to work with the DISCOVER team to figure out the problem and how to fix it.” Kelly added, “And the thing about cruises is that it’s not okay if they miss a couple of days of data. The DISCOVER team and Suzanne were tag-teaming every day to make sure the crew had a map each afternoon. Ocean-going scientists don’t want to go out without their satellite maps—it would be like taking a cross-country tour without your road atlas or GPS.”
Understanding the ocean’s memory
Joyce, Kelly, Dickinson, and the other scientists involved in the study, called the Climate Variability and Predictability Mode Water Dynamics Experiment (CLIMODE), hope that the years of work, the many stormy wintertime cruises, and the unique combination of satellite and shipboard data will ultimately improve our understanding of both mode water and climate on Earth.
Because of the ocean’s predilection for slow change, understanding the current state of mode water and how it may influence future climate are uppermost in the minds of oceanographers. Some oceanographers who study Greenland ice cores as a paleological record of climate have suggested that if global warming continues, we could see changes in ocean circulation that could cause abrupt or extreme changes in climate.
Joyce said, “But before we can understand how heat transport is going to evolve in a warming world, we have to understand how the basic system works: If you had more heat transported by the Gulf Stream, would that make it more stormy? Or would it change where the storms happen? And if you perturb the system, how would it react? Right now, we don’t know. But that’s what we’re hoping to learn.”
References
Kelly, K., R. Jones, and S. Dickinson. 2006. SST, winds, and air-sea fluxes in the Gulf Stream region in the first winter of CLIMODE. Eos, Transactions, American Geophysical Union 87(52), Fall Meeting Supplement, Abstract OS44A-02.
Peña-Molino, B., and T. Joyce. 2008. Variability in the slope water and its relation to the Gulf Stream path. Geophysical Research Letters 35, LO3606, doi:10.1029/2007GL032183.
Woods Hole Oceanographic Institute. The hunt for 18° water. http://www.whoi.edu/oceanus/viewArticle.do?id=11274
For more information
NASA Global Hydrology Resource Center Distributed Active Archive Center (GHRC DAAC)
NASA National Snow and Ice Data Center (NSIDC DAAC)
NASA DISCOVER
Climate Variability and Predictability (CLIVAR) Mode Water Dynamic Experiment (CLIMODE)
University of Washington Applied Physics Laboratory
Woods Hole Oceanographic Institution
| About the remote sensing data |
| Satellites |
QuikSCAT |
TOPEX/Poseidon/Jason-1 |
Aqua |
| Sensors |
SeaWinds scatterometer |
Nadir-pointing radar altimeter |
Advanced Microwave Scanning Radiometer for Earth Observing System (AMSR-E) |
| Data sets |
QuikSCAT near-real-time ocean wind vectors |
Sea surface height |
Sea surface temperatures |
| Resolution |
25 kilometers |
0.0001° in latitude and 0.05° in longitude |
25 kilometer |
| Parameters |
Wind vectors |
Sea surface height |
sea surface temperature |
| DAACs |
NASA Physical Oceanography Distributed Active Archive Center (PO.DAAC) |
NASA PO.DAAC |
NASA National Snow and Ice Data Center DAAC (NSIDC DAAC) |

