Konrad Steffen arrived on the Greenland Ice Sheet for the 2002 summer fieldwork season and immediately observed that something significant was happening in the Arctic. Pools of water already spotted the ice surface, and melting was occurring where it never had before. “That year the melt was so early and so intense — it really jumped out at me. I’d never seen the seasonal melt occur that high on the ice sheet before, and it had never started so early in the spring,” said Steffen, principal scientist and interim director at the Cooperative Institute for Research in Environmental Sciences (CIRES) at the University of Colorado.
Vanishing Ice
By the end of the 2002 season, the total area of surface melt on the Greenland Ice Sheet had broken all known records. That same summer, Mark Serreze and his colleagues at the National Snow and Ice Data Center in Boulder, Colorado, began noticing unusually low levels of sea ice in the Arctic, based on remote sensing data. “I was really surprised by the change,” Serreze said. “By the end of the summer, sea ice levels in the Arctic were the lowest in decades and possibly the lowest in several centuries.”
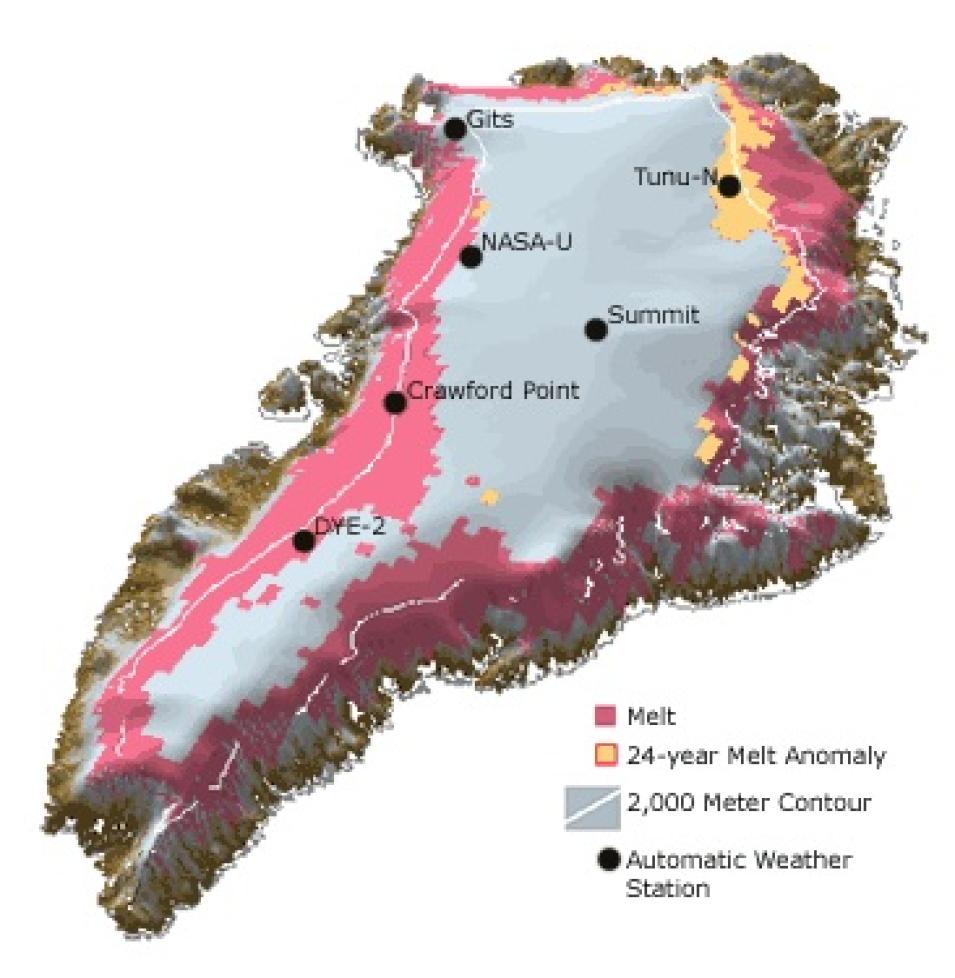
Seasonal melt areas on the Greenland Ice Sheet are generally located along the edges of the ice sheet at its lowest points. In 2002, however, the melt started unusually early and progressed higher up the ice sheet than at any time in the past 24 years. Surface melting extended up to 6,560 feet (2,000 meters) in elevation in the northeast portion of the island, where temperatures normally are too cold for melting to occur. In addition, the total melt area covered 265,000 square miles (686,350 square kilometers), representing a 16 percent increase above the maximum melt area measured in the past 24 years.
Serreze’s team coincidentally discovered that in September 2002, Arctic sea ice extent was approximately 400,000 square miles (1.04 million square kilometers) less than the long-term average of 2.4 million square miles (6.2 million square kilometers), and that much of the remaining sea ice was unusually thin and spread out.
To determine whether their independent findings were related, the research teams measured the sea ice extent and ice sheet melt using passive microwave data from satellites, including data from the NIMBUS-7 Scanning Multichannel Microwave Radiometer (SMMR) (1978-1987) and its successor, the DMSP Special Sensor Microwave/Imager (SSM/I) (1987-present).
Passive microwave sensors provide data that are processed into brightness temperatures. Brightness temperatures are both a measure of the physical temperature within the snow and a gauge of emissivity, or the ability of water or ice/snow to emit radiation at the microwave frequencies (frequencies in the centimeter wavelength range). Dry snow emits much less radiation than wet snow, which behaves almost like a perfect emitter (blackbody), giving off a wide range of frequencies of radiation. Therefore, dry snow and ice have lower brightness temperatures than wet snow surfaces.
The brightness temperature of seawater (ice-free ocean) is much lower than that of ice/snow or melting ice/snow. By calculating daily brightness temperatures (from the daily pass of the satellite over the Arctic), scientists can determine the extent of sea ice in the Arctic and the extent of melt on the Greenland Ice Sheet. Because the microwave instrument can “see through” clouds and darkness, ice extent can be monitored year-round, even during storms and winter darkness.
A trend in lower concentrations of Arctic sea ice may mean that historically unnavigable areas of the Arctic may open, such as the famed Northwest Passage. If current warming continues and results in lower ice concentrations, the Northwest Passage could become accessible to ice-strengthened ships, opening the area not just as a trade route, but also as a means to economically exploit the far north. This could have profound economic implications in addition to sociological implications for Arctic peoples such as the Inuit, who depend on the ice cover for travel and hunting.
Emissivity and Brightness Temperatures
by Jason Wolfe
Remote-sensing satellites measure the amount of radiance reflected or emitted by the Earth’s surface. Scientists who study the temperature of objects at the Earth’s surface need an additional factor called emissivity to accurately calculate temperature. Emissivity represents the effectiveness of different objects to radiate thermal energy and is a ratio of an object’s radiant energy to that of a blackbody at the same temperature. A blackbody is an ideal object that absorbs all incoming energy without reflecting back any energy.
Given the emissivity of an object, microwave radiances are converted to brightness temperatures, which are a measure of the intensity of thermal radiation emitted by an object.
Some researchers, however, believe that recent Arctic warming is only a recurring peak in a long-term Arctic climate cycle. A group of Alaskan researchers recently published their assessment of Russian long-term observations of air temperature from coastal stations, and sea-ice extent and fast-ice thickness from Arctic seas. They found a great deal of variability in Arctic temperatures, with cyclic fluctuations on a timescale of 60 to 80 years. A climate cycle of this length might mean that the Arctic will cool again soon, rather than continue warming.
Given these findings and the world’s interest in global climate change, long-term observations are essential to understanding Arctic climate change. “Climatologists generally need a 30-year mean (or average) to be able to talk about trends in climate variability. With the availability of data from satellites that have been in orbit for 24 years, scientists now have close to that 30-year standard, which is unique,” said Steffen.
“The real question is, is this recent trend unusual?” said Serreze. Both teams will rely on the orbiting “eyes” of satellites to observe Arctic ice conditions over the next few years as they attempt to determine whether these changes are part of a long-term climate cycle or whether the Arctic is experiencing an ongoing warming trend.
References
Abdalati, W. and K. Steffen. 2001. Greenland Ice Sheet melt extent: 1979-1999, Journal of Geophysical Research. 106:33,983 - 33,989.
Polyakov, I.V., G.V. Alekseev, R.V. Bekryaev, U. Bhatt, R.L. Colony, M.A. Johnson, V.P. Karklin, A.P. Makshtas, D. Walsh, and A.V. Yulin. 2002. Observationally based assessment of polar amplification of global warming. Geophysical Research Letters. 29(10):1029.
Serreze, M.C., J.A. Maslanik, T.A. Scambos, F. Fetterer, J. Stroeve, K. Knowles, C. Fowler, S. Drobot, R.G. Barry, and T.M. Haran. 2002. A record minimum Arctic sea ice extent and area in 2002. Geophysical Research Letters. 30(3):1110.
For more information
NASA National Snow and Ice Data Center Distributed Active Archive Center (NSIDC DAAC)
Arctic Sea Ice Shrinking, Greenland Ice Sheet Melting, According to Study
| About the remote sensing data used | ||
|---|---|---|
| Satellite | NIMBUS-7 | Defense Meteorological Satellites Program (DMSP) |
| Sensor | Scanning Multichannel Microwave Radiometer (SMMR) | Special Sensor Microwave Imager (SSM/I) |
| Parameter | Arctic oscillation | Arctic oscillation |
| DAAC | NASA National Snow and Ice Data Center Distributed Active Archive Center (NSIDC DAAC) | NSIDC DAAC |

