Time and Tide

Scientists pit nature against nature to protect New Yorkers from storms.

Oceanographer and engineer Stefan Talke had become a kind of historian. In the U.S. National Archives and at other archives around the world, he searched out forgotten tide gauge records of the Pacific Ocean and North America. The records date as far back as the mid-1800s. Some had been digitized; others were still sitting in boxes. He photographed old paper graphs and logbooks, and his students at Portland State University helped tabulate the records.

The tide level measurements strung from ports in Florida and up the U.S. East Coast into Canada, then from Alaska down the U.S. West Coast and along the Pacific Rim from Japan to New Zealand. The data would help reconstruct a history of sea levels, and extreme storms that pushed tide levels up. Like other researchers, Talke wanted to be able to measure how tide levels had changed, and how much of the change might be caused by a warming climate or by how people have modified estuaries—the places where fresh and salt water meet—to better suit their uses. When he ran into oceanographer Philip Orton at a conference in 2012, he was headed to the New York City branch of the National Archives to hunt for more tide records, and agreed to look for storm records for Orton too.

The data would help them sooner than they thought, and in unexpected ways. Two months later, Hurricane Sandy drowned the New York and New Jersey coasts in a catastrophic storm surge. Orton, who lives and works in the area, immediately shifted his focus to how he as a scientist could help. “Before Sandy we were saying storm risks will get worse in the future,” Orton said. “Suddenly my job went from talking about what might happen in the future, to helping people see how they could ameliorate it.” And during this time Orton and Talke began to see the past as part of a future solution.
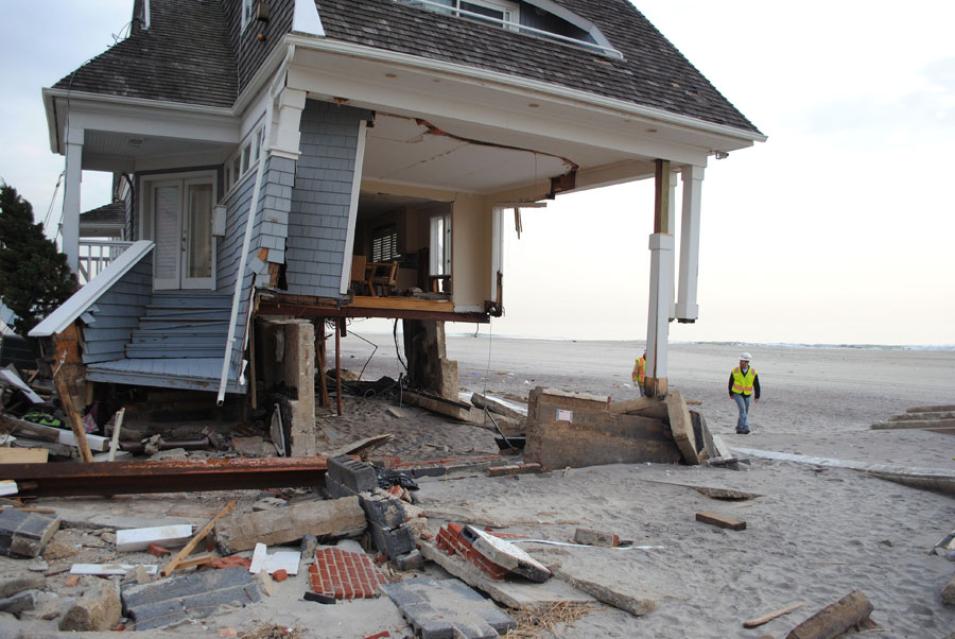
Photograph of what remains of a home in New York after it was damaged by Hurricane Sandy
Image Caption

A debris engineer with the U.S. Army Corps of Engineers inspects a house damaged by Hurricane Sandy in Queens, New York. (Courtesy B. Beach, U.S. Army Corps of Engineers)

The future is now

Even before Sandy, Orton, a physical oceanographer at the Stevens Institute of Technology in New Jersey, saw how the rescued data could help his work improving storm surge forecasts. He was especially interested in a big storm that had hit New York City in its early days.

So at the archives in New York City, Talke labored through boxes of tide gauge records from the nineteenth and twentieth centuries and old newspaper accounts of storms. He searched for information about what was then the only hurricane to make a direct hit on New York. The storm, named the Norfolk and Long Island Hurricane, bashed the Caribbean and skipped along the East Coast, destroying houses in North Carolina and whipping Virginia with its strongest winds. It made landfall at New York City in the evening of September 3, 1821. Manhattan Island was completely flooded to Canal Street. The storm surge reached 13 feet at Battery Park, a record only broken by Sandy 191 years later. Floods and winds tore apart houses, ripped wharves from their foundations, and blew ships ashore. Few deaths were reported, though a house on Broadway collapsed and killed ten cows.

Small and fast-moving, the 1821 storm hit New York like a freight train. Water levels surged in an hour and left almost as quickly. In contrast, Sandy was the largest storm ever measured in the Atlantic. Nearly a thousand miles wide, it parked its wrath over the coast for three days then arrived onshore, piling up the ocean on the land and lashing cities and towns with winds and rain.

Sandy fit the mold of future storms that worry scientists. As the Earth warms, climate models forecast storms to be intensified by warmer ocean waters and disrupted climate patterns. And as glaciers and ice caps melt and sea level increases, existing defenses from storm surge can be overwhelmed. Hurricane winds are dangerous, but storm surge can be more devastating. A large storm surge brings floods and ushers in waves that pound structures with a power of 1,700 pounds per cubic yard. Sandy’s peak winds had dropped from 115 to 80 miles per hour by the time it made landfall. It was mainly the storm surge and flooding that killed 49 people and caused $42 billion in damage in New York alone, and shut down the entire city for days.

Photograph of volunteers bailing water out of a museum in New York City after Hurricane Sandy
Image Caption

Volunteers bail out the Museum of Reclaimed Urban Space in East Village, New York City, following Hurricane Sandy. (Courtesy B. Cavanaugh)

Tale of two or three cities

In the days following Sandy, talk turned to a $20 billion plan to protect New York City. Planners looked to solutions used in other low-lying regions in the world. After Hurricane Katrina, New Orleans and the U.S. Army Corps of Engineers built 133 miles of levees, flood gates, and seawalls, some up to 54 feet high, around the city. The Netherlands, where half the country lies less than one meter above sea level, spends around $1.3 billion a year on water control. Known for their dikes, the Dutch have been turning to nature for help. Recently, the country dumped 706 million cubic feet of sand off the coast north of Rotterdam to promote the formation of protective sandbars.

After a multi-million dollar design competition, plans include hardening the city’s utilities and transportation systems, as well as protecting the coastlines from flooding. In New York City, Lower Manhattan would be surrounded by flood walls and levees, and raised earthen berms that would also serve as a park. “New York City and the Corps of Engineers want natural solutions, but they don’t see any options,” Orton said. Skeptical that engineered solutions are the only or best defenses, Orton wanted to bring science to the discussion. As a hydrodynamic modeler, he knew how water moves, and what slows and stops it in nature.

But Orton and Talke turned their thoughts to something odd in the historical tide and storm data. “Storm surge has been increasing in the last 100 years, increasing much faster than sea level rise,” Talke said. “Why is this happening?” They suspected that storm surge has outpaced sea level rise because of how humans have changed the environment. Wetlands that used to absorb storm surges were filled to build homes, airports, parks, and businesses. Port builders dredged deep channels for shipping, giving waters a fast track to the cities that burgeoned around them. Could undoing some of these changes protect cities from storm surges?

Wetlands are known to slow and absorb storm surge, and limited restoration of some wetlands is in progress. But Orton knew the limits of this measure. “The rule of thumb is one foot of flood reduction from every 2.7 miles of wetlands that the storm has to pass over,” he said. That would translate to 27 miles of wetlands to stop a ten-foot surge. While this might work along the swampy coasts of Louisiana, it may not work for people who live right up to the shores in New York and New Jersey.

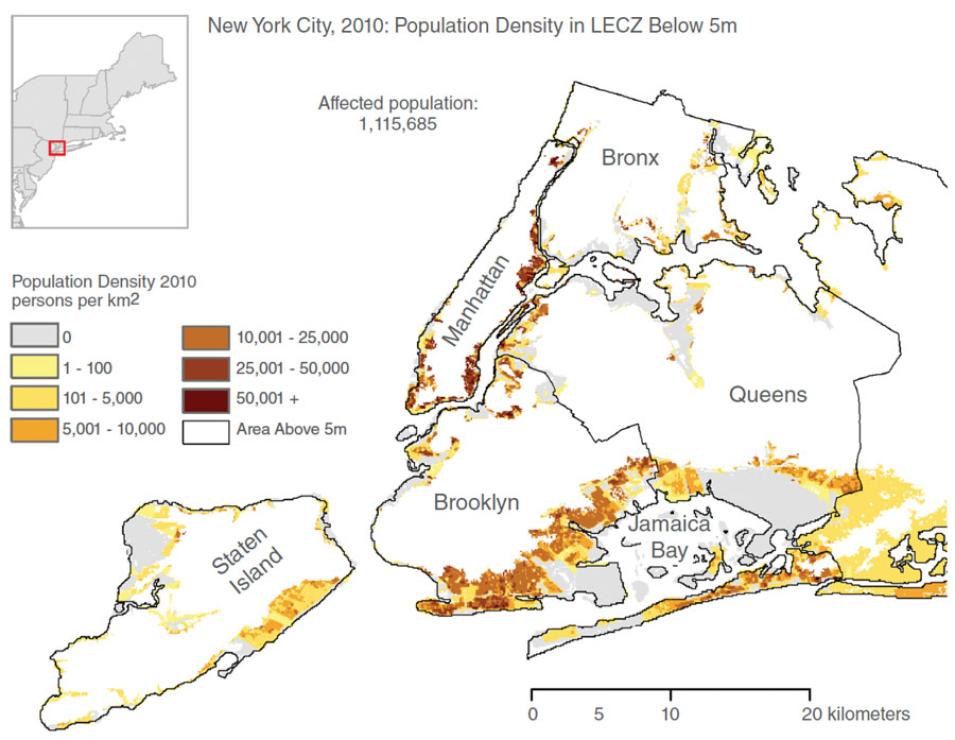
Map showing New York City population density in low-elevation coastal zones
Image Caption

This map of the New York City boroughs and the western edge of Nassau County (right edge of the map) shows the population density in contiguous low-elevation coastal zones below 5 meters above mean sea level. The population density data are based on 100-meter resolution 2010 population data. Lidar elevation data at 1-meter resolution are used to filter for elevation; the map only shows population density data where more than 50 percent of a cell area is below 5 meters in elevation. (Courtesy K. MacManus)

Experimenting with nature

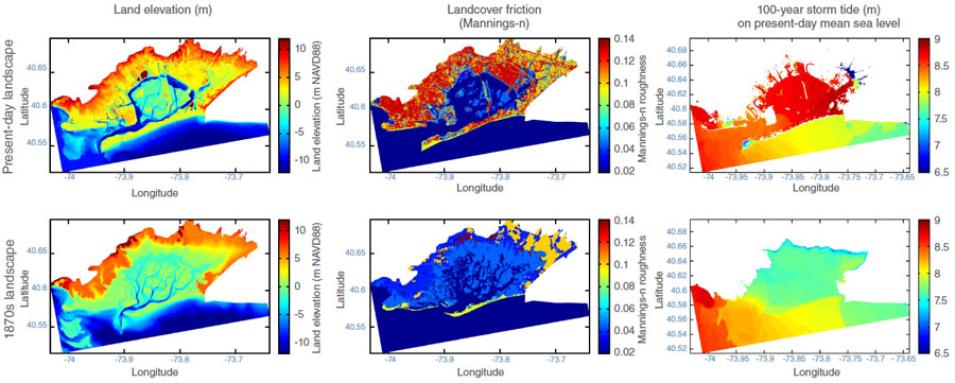
Amidst this talk of reversing history to prepare for the future, it occurred to the researchers that the deep shipping channels could be part of the answer. What if they were shallowed? “Jamaica Bay right away struck me as one place in the New York City area that would be good to study,” Orton said. In 1821, southern Long Island was swampier, and Jamaica Bay, at its southwest end, was shallower. Since then, more than 12,000 acres or 75 percent of the original wetlands have been lost, and the bay dredged for three shipping channels. Like wetlands, shallow waters add friction, and friction slows water movement and helps keep water from entering the bay.

With a small grant from the National Oceanic and Atmospheric Administration, Orton fired up his hydrodynamic models to test these ideas. He ran a scenario in which Jamaica Bay’s wetlands were restored to their 1879 footprint and depths, and another in which the inlet was shallowed to no more than two meters at low tide. A third scenario simulated what would happen if only the narrowest inlet was made shallower. All three scenarios were run against simulations of both Sandy and the 1821 hurricane.

The results were encouraging. The wetland scenario by itself provided little relief from either storm. Shallowing the entire bay reduced water levels by 15 percent for Sandy, but 46 percent for the fast-pulse 1821 storm. Shallowing only the narrowest inlet was more effective than wetland restoration for a slow-moving storm like Sandy, and provided a 30 percent reduction for the 1821 storm.

Orton admits that there would be practical issues to shallowing the bay. Although Jamaica Bay’s deep shipping channels are used less for commercial shipping and more for tasks like moving sewage sludge out of the city, still there would be some economic impact if the channels were shallowed. Bringing in large amounts of sand to fill the channels requires a massive source of sand, and it is not certain that the sand will stay put.

Or the channels could be decommissioned and allowed to fill naturally over decades. Orton thinks there might be time for that. Sea level rise helps hurricane storm surge get up on the shore, and model forecasts say sea level will be about two to six feet higher in New York by the year 2100. Shallowing could provide some relief for several decades as scientists and engineers continue to ponder ways to protect coastal areas. Shallowing may also have fewer unwanted side effects than other measures, according to the simulations. “When you use these approaches to reduce flooding, they don’t cause flooding to happen somewhere else,” Orton said. “If you do it right, if you don’t choke the inlet too much, these approaches have a capacity for absorbing and not reflecting the surge.”

Data maps comparing the elevations, land friction, and storm tide levels for Jamaica Bay, New York, for the 1870s and the present day
Image Caption

These maps of Jamaica Bay show how long-term changes to the landscape have affected storm tides. The left column shows the land elevation for the present day and for the 1870s, before the bay was altered for human purposes. The center column shows the relative friction of the land cover for the present landscape and for the 1870s, measured with the variable “Mannings-n roughness.” The third column shows modeled storm tide levels on the present-day and 1870s landscapes, based on present-day mean sea level. (Courtesy P. Orton)

People and place

In 1821, Manhattan had a population of about 123,000. Today, 20 million people live in the greater New York City area. Orton and Talke’s study included a population map showing the risks in the Jamaica Bay area. More than 1.1 million people in New York City boroughs and Nassau County live in low-elevation coastal zones, below five meters (16 feet) above mean sea level.

“The NASA low elevation population data were valuable,” Orton said. “It shows that there’s just as much of a population around the bay as in Manhattan.”

“The sheer number of people in that situation is challenging to manage,” said Kytt MacManus from the Center for International Earth Science Information Network (CIESIN) at Columbia University, who developed the localized maps from one of NASA's Socioeconomic Data and Applications Center (SEDAC) data sets. Evacuation would push millions of people over gridlocked roads and through choked bridges and tunnels. “And many people are unwilling to evacuate,” MacManus said, alluding to research showing about half of people ordered to evacuate refuse to or are reluctant to leave, or face barriers to leaving such as age, illness, or poverty. “Without making policymakers aware of elevation issues, and making the connection to the number of people impacted, it is hard to get their attention. The data broaden the community that registers on their radar,” MacManus said.

MacManus thinks the study’s historical and scientific approach helps residents, too. “It builds a context for people to understand the place that is their home,” he said. “The bay is a dynamic place. We are living in areas that over time have dramatically changed, and will continue to change.”

People figure in Orton’s research in other ways. “A lot of work is design first and public input later. This study was built with the public and decision makers involved,” Orton said. “It’s important to interact with real people. There’s a lot of fear of big change.” He is now also studying narrowing as well as shallowing. “We’re working hard for scientists to be heard in the conversation,” he said. “There are options for flood protection other than walling ourselves in.”

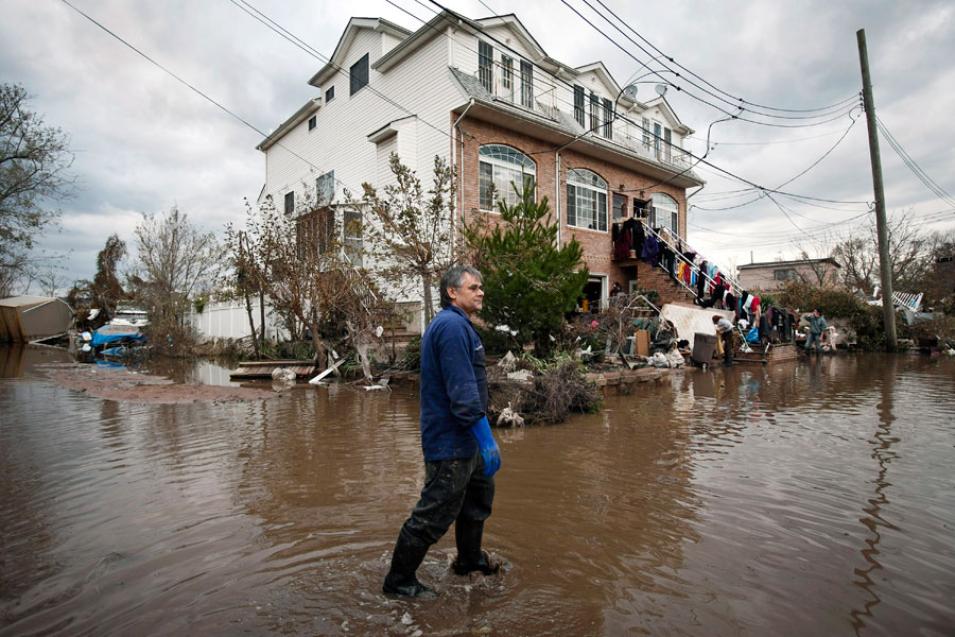
Photograph of a man wading through flooded streets in Staten Island, New York
Image Caption

A man slogs through flooded streets as residents clean out their homes in Midland Beach, Staten Island, New York following Hurricane Sandy. (Courtesy N. Dvir, Polaris)

References

Center for International Earth Science Information Network - CIESIN - Columbia University. 2013. Low Elevation Coastal Zone (LECZ) Urban-Rural Population and Land Area Estimates, Version 2. Palisades, NY: NASA Socioeconomic Data and Applications Center (SEDAC). doi:10.7927/H4MW2F2J.

Orton, P. M., S. A. Talke, D. A. Jay, L. Yin, A. F. Blumberg, N. Georgas, H. Zhao, H. J. Roberts, and K. MacManus. 2015. Channel shallowing as mitigation of coastal flooding. Journal of Marine Science and Engineering 3(3): 654–673. doi:10.3390/jmse3030654.

Talke, S. A., and D. A. Jay. 2013. Nineteenth century North American and Pacific tidal data: lost or just forgotten? Journal of Coastal Research 29(6A), 118–127. Coconut Creek (Florida), ISSN 0749-0208. doi:10.2112/JCOASTRES-D-12-00181.1.

For more information

NASA Socioeconomic Data and Applications Center (SEDAC)

AdaptMap - Flood, sea level rise, and adaptation mapper for Jamaica Bay, New York City

About the data
Data set Low Elevation Coastal Zone (LECZ) Urban-Rural Population and Land Area Estimates
Resolution 3 arc seconds, 30 arc seconds
Parameter Population
DAAC NASA Socioeconomic Data and Applications Center (SEDAC)

Details

Last Updated

Published

Data Center/Project

Socioeconomic Data and Applications Center (SEDAC)