Air pollution is a serious problem around the globe. According to data from the World Health Organization, almost all of Earth’s population (99%) breathes air that exceeds WHO guideline limits and contains high levels of pollutants, with low- and middle-income countries suffering from the highest exposures.
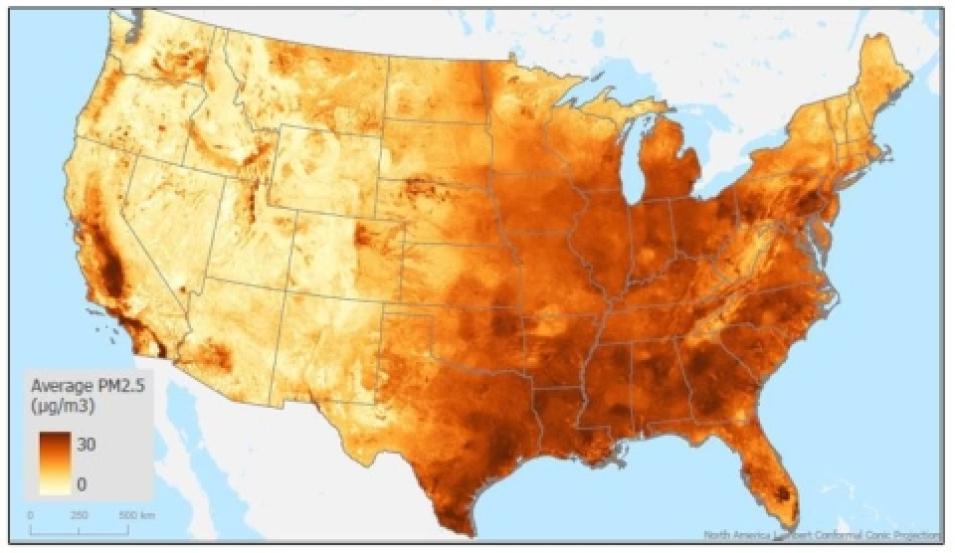
Although there are many toxins that can adversely affect human health, the pollutants thought to pose the biggest risk to public health include fine particulate matter (PM2.5), ozone (O3), and nitrogen dioxide (NO2). PM2.5 is especially concerning, as these small particles (designated as having a diameter of less than 2.5 micrometers) can penetrate deep into the lungs, enter the bloodstream, and travel to organs causing damage to tissues and cells. Further, the Global Burden of Disease study, a publication of the Institute for Health Metrics and Evaluation at the University of Washington School of Medicine, reports that exposure to high levels of air pollution is a significant cause of premature death worldwide.
To assist public health, environmental, and air quality researchers in their investigations of pollution’s effects on human health, NASA’s Socioeconomic Data and Applications Center (SEDAC) created an Air Quality Data for Health-Related Applications data collection that currently consists of three data products. The datasets were developed by a team of researchers from Harvard University’s T.H. Chan School of Public Health (SPH), led by Dr. Joel Schwartz, Professor of Environmental Epidemiology. The three datasets are:
- Daily and Annual PM2.5 Concentrations for the Contiguous United States (2000–2016), offering predictions of PM2.5 concentrations in grid cells at a 1-kilometer (km) spatial and daily temporal resolution for the years 2000 to 2016. It was created with a generalized additive model that accounts for geographic difference to ensemble daily predictions from the machine learning models incorporating multiple predictors, including satellite data, meteorological variables, land-use variables, elevation, chemical transport model predictions, several reanalysis datasets, and other predictors. The annual predictions were calculated by averaging the daily predictions for each year in each grid cell.
- Daily 8-Hour Maximum and Annual O3 Concentrations for the Contiguous United States (2000–2016), containing estimates of ozone concentrations at a 1-km spatial and daily temporal resolution for the years 2000 to 2016. These predictions incorporate various predictor variables, such as O3 ground measurements from the U.S. Environmental Protection Agency (EPA) Air Quality System monitoring data, land-use variables, meteorological variables, chemical transport models, and remote sensing data, along with other data sources. The annual predictions were computed by averaging the daily 8-hour maximum predictions in each year for each grid cell.
- Daily and Annual NO2 Concentrations for the Contiguous United States (2000–2016), offering daily predictions of NO2 concentrations at 1-km spatial and daily temporal resolution for the years 2000 to 2016. An ensemble modeling framework was used to assess NO2 levels with high accuracy, which combined estimates from three machine learning models with a generalized additive model. Predictor variables included NO2 column concentrations from satellites, land-use variables, meteorological variables, predictions from two chemical transport models (GEOS-Chem and the U.S. EPA Community Multiscale Air Quality Modeling System), along with other ancillary variables. The annual predictions were calculated by averaging the daily predictions for each year in each grid cell.
SEDAC, which is hosted at Columbia University’s Center for International Earth Science Information Network (CIESIN), is the NASA Earth Observing System Data and Information System (EOSDIS) Distributed Active Archive Center (DAAC) responsible for archiving and distributing socioeconomic data in the EOSDIS collection. SEDAC synthesizes Earth science and socioeconomic data and serves as an “information gateway” for a wide range of decision-makers and other applied users, including those working in the disciplines of public health and epidemiology. In addition, SEDAC supports the dissemination of third-party datasets and, with the guidance of its User Working Group, has developed comprehensive submission guidelines for authors to better enable the hosting of datasets such as this important air quality triad.
“There has long been a recognition that satellite data could inform the measurement air pollutants such as PM2.5, NO2, and O3,” said Dr. Alex de Sherbinin, SEDAC deputy manager. “PM2.5 in particular is one of the leading killers in the world. If you look at the global burden of disease, it’s among the top causes of premature death, particularly in regions like Asia where pollution levels are high owing to coal-fired power plants. Dr. Schwartz’s data are important for many users in the public health and environmental fields, and a complement to a number of global gridded products hosted by SEDAC that measure average PM2.5 and NO2 concentrations at annual time steps.”
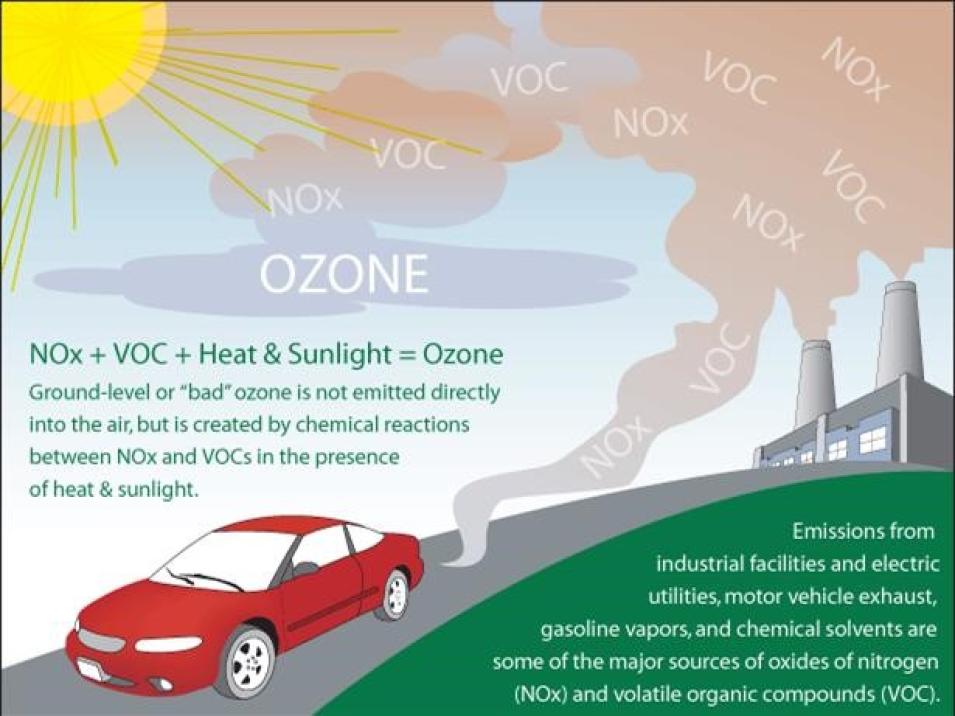
NO2, one of a group of highly reactive gases known as nitrogen oxides (NOx), is known to cause significant respiratory conditions. NO2 primarily gets in the air from the burning of fossil fuels, including emissions from cars, trucks and buses, power plants, and off-road equipment. According to the EPA, brief exposure to high concentrations of NO2 can irritate respiratory airways and aggravate respiratory diseases, particularly asthma, resulting in coughing, wheezing, or difficulty breathing. NO2 and other NOx gasses can also react with other chemicals in the air to form both particulate matter and ozone, and with water, oxygen, and other chemicals in the atmosphere to form acid rain, which can have significant impacts on ecosystems such as lakes and forests.

