The world’s oceans provide us with the seafood that fills our plates and tempts our taste buds: tuna, salmon, lobster, scallops. All of this sea life is part of a complex food web that can support an abundant and diverse range of plants and animals. Like a house of cards, that food web rests on its lowest and least-known participants; if the first level gets shaky, all the levels above teeter, too. The lowest level in the ocean food web consists of historically abundant and productive phytoplankton, tiny ocean plants that convert carbon dioxide to organic carbon, and whose green chlorophyll is visible from space. Satellites can detect this chlorophyll, and scientists use the data to estimate ocean productivity, a measure of the amount of organic carbon available to support the food web.
An Ocean full of Deserts
However, the abundance of phytoplankton appears to be shrinking. Ocean biologist and satellite data enthusiast Jeffrey Polovina said, “We saw that the low-productivity area of the west Pacific was expanding, and we wondered if it was unique or if it was happening globally.” Models predict that the warmest portions of the world’s oceans will become less productive because of climate change. Some people call these low productivity regions “biological deserts.” Polovina said, “The climate models are on century timescales and suggest that the rate of expansion of these expected low-productivity areas will be slow.” But the scientists wanted to compare those modeled expectations with observations.
Phytoplankton and ocean temperature
To evaluate ocean habitat from space, scientists first have to understand it close up. The mixing of different layers of water is one reason that high productivity areas exist in the world’s oceans. One of the signatures of global warming is rising ocean temperatures. As the surface layer of the ocean warms, the water becomes less dense and stays on top rather than mixing down to allow cooler, nutrient-rich water to well up. Over time, areas with less mixing show reduced productivity, less phytoplankton, and so less chlorophyll. Polovina said, “Regions that have the lowest level of chlorophyll are akin to biological deserts; there’s less energy propagating up through the food web.”
To study the formation of ocean deserts, Polovina worked with colleagues Evan Howell and Mélanie Abécassis to use surface chlorophyll data. The data, from the NASA Sea-Viewing Wide Field-of-View Sensor (SeaWiFS), which is operated by GeoEye and processed, archived, and distributed by NASA's Ocean Biology Distributed Active Archive Center (OB.DAAC) at NASA’s Goddard Space Flight Center, helped them locate areas where low-chlorophyll regions were expanding during their nine-year time series of data. Abécassis, who helped process the data, said, “The data set is amazing, with fantastic resolution and global coverage.” In addition, the data offered the team quality information. “The only challenge with working with the data was also one of the best things about it: we had to download all the data again and reprocess it because NASA released a new version after correcting for a sensor defect,” she said. “It took more time, but it made our results increasingly accurate.”
The team also used sea surface temperature data from the Advanced Very High Resolution Radiometer (AVHRR), available at NASA's Physical Oceanography DAAC (PO.DAAC). While many factors can reduce ecosystem productivity—overfishing, for example, or El Niño, a cyclic condition characterized by higher-than-normal sea surface temperatures—global warming is expected to herald particularly large reductions in productivity. Studies predict that if global warming intensifies, areas with decreasing chlorophyll will match up with areas of increasing sea surface temperature.
Polovina said, “With chlorophyll and temperature data, we could begin to find out what was happening to global ocean productivity.”
The growing desert
The team’s results were noteworthy. Polovina said, “We were very surprised. We looked at the North Atlantic, the South Atlantic, the Indian Ocean—we saw the same trends all over the globe. Over nearly the past decade, regions with low surface chlorophyll were expanding into nearby ocean basins. The total area lost was quite enormous.” The area of new global ocean desert added up to 6.6 million square kilometers (2.5 million square miles), representing about a 15 percent expansion in the area of the least productive waters between 1998 and 2006. Plus, the connection to sea surface temperature was clear. “The expansion of low-productivity waters matched up with significant increases in sea surface temperature,” Polovina said.
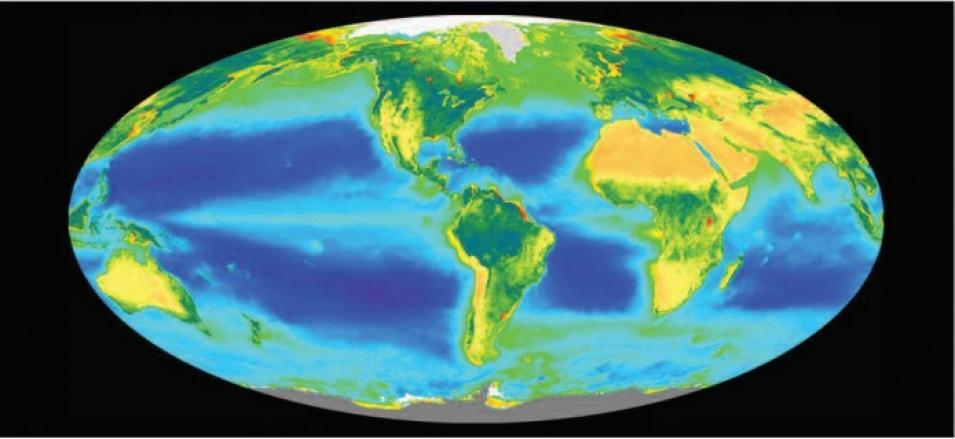
Phytoplankton are microscopic ocean plants that form the base of ocean ecosystems; they are so abundant that they are visible from space. Here, average chlorophyll from 1998 through 2006 is shown in green and indicates areas of high biological productivity. (Courtesy SeaWiFS Project/NASA GSFC and GeoEye, Inc.)
The team also noticed that the changes over the past decade were seasonal. “There was greater expansion from one winter to the next than from one summer to the next,” Polovina said. “In the summer, regions of low chlorophyll expanded; in the winter, those areas would naturally contract—but to a larger size than we saw the previous years.” So the expansion of ocean deserts proceeded in a step-by-step fashion over the nine-year time series.
But perhaps the most surprising aspect of the team’s findings was the rate of expansion: this step-by-step desertification has led to a 1 to 4 percent loss in productive waters per year. Abécassis said, “The actual rate of expansion was much bigger than the models predicted.”
A recent study using six climate models suggested that between the beginning of the Industrial Revolution and 2050, the total growth in low-productivity areas in the Northern and Southern Hemispheres would range from 0.7 percent to 8.1 percent, depending on various parameters. Polovina said, “We’ve measured more than even the high range in only nine years.”
An unproductive future
The question that remains unanswered, in Polovina’s mind, is why ocean deserts are expanding. “We’re seeing these changes in all the world’s oceans,” he said, “which is suggestive of either a ten-year global signal or a long-term global warming trend.” So which is it?
The team is careful to point out that their study covers nine years, approximately the length of time that SeaWiFS has been taking data. Although nine years is a reasonably long time series, scientists prefer to base their research on longer time series of thirty or more years to ensure that natural cycles, such as El Niño and its opposite, La Niña, characterized by lower than normal sea surface temperatures, have been taken into account. “During the period of our study there have been several La Niña events, so the large-scale climate has been unique,” Polovina said. “It’s possible that the trend will reverse in the coming decade. Or, it could be that the trend holds and the losses really are worse than what models are indicating they should be.” Either way, Polovina feels that the research bears on global warming. He said, “Even if this trend is just a decadal signal that gets reversed, this is the type of expansion we would expect to see under global warming. This sort of change is something we need to be prepared for.”
The growth of biological deserts in the world’s oceans, and what may come along with it in the future, has Polovina’s attention. “This is a unique biological signal that we’re seeing. What this means is that the ability of the oceans to support life has decreased,” he said. “The density of mahi-mahi, shark, tuna, et cetera, will be less.” Abécassis agreed, saying, “The expansion of poor productivity areas is a major concern—with implications for ocean food webs and potentially a lot of changes for fisheries.” Scientists like Polovina and Abécassis can help tell the story of the unfolding changes now happening to our oceans. With scientific information behind them, fisheries and policy makers may be able to plan and prepare, softening the blow on particular species and preserving the ocean ecosystem’s long-standing food web.
References
Feldman, G. Monitoring the Earth from space with SeaWiFS. http://oceancolor.gsfc.nasa.gov/SeaWiFS/TEACHERS/sanctuary_1.html
Polovina, J., E. Howell,and M. Abécassis. 2008. Ocean’s least productive waters are expanding. Geophysical Research Letters 35, L03618, doi:10.1029/2007GL031745.
Sarmiento, J. L., et al. 2004. Response of ocean ecosystems to climate warming. Global Biogeochemical Cycles 18, GB3003, doi:10.1029/2003GB002134.
For more information
NASA Ocean Biology Distributed Active Archive Center (OB.DAAC)
NASA Physical Oceanography DAAC (PO.DAAC)
Sea-Viewing Wide Field-of-View Sensor (SeaWiFS)
Advanced Very High Resolution Radiometer (AVHRR)
| About the remote sensing data | ||
|---|---|---|
| Satellites | GeoEye SeaStar | NOAA Polar Orbiting Satellites |
| Sensors | Sea-Viewing Wide Field-of-View Sensor (SeaWiFS) | Advanced Very High Resolution Radiometer (AVHRR) |
| Data sets | Ocean color | AVHRR Pathfinder SST |
| Resolution | 9 kilometer | 9 kilometer |
| Parameters | Surface chlorophyll | Sea surface temperature |
| DAACs | NASA Ocean Biology Distributed Active Archive Center (OB.DAAC) | NASA Physical Oceanography DAAC (PO.DAAC) |


