New Light on Ice Motion

NASA ESDIS article describing research uses of data - MODIS aids the study and interpretation of the history of Antarctic temperature and climate records.

Detailed antarctic temperature and climate records date only from the late 1950s, with limited information dating from the turn of the 20th century. Now, using visible and near-infrared satellite imagery, scientists have pieced together a preliminary glaciological history of Antarctica spanning nearly a millennium. The availability of new imagery from the Moderate-resolution Imaging Spectroradiometer (MODIS), launched aboard NASA's Terra satellite in 1999, has further aided the study and interpretation of this history.

"Prior to MODIS we had a fair bit of success looking at surface features of the Antarctic Ice Sheet and the Ross Ice Shelf using 1 kilometer data from the Advanced Very High Resolution Radiometer (AVHRR) and Landsat sensors," said Mark Fahnestock, assistant research scientist at the University of Maryland. "The Antarctic ice sheet bears a tremendous amount of information about the bedrock and history of the ice flow, incorporated in fairly subtle surface features. MODIS has an advantage over AVHRR and previous sensors because of its unprecedented level of radiometric resolution. It is more sensitive to reflected light than any of the other sensors."

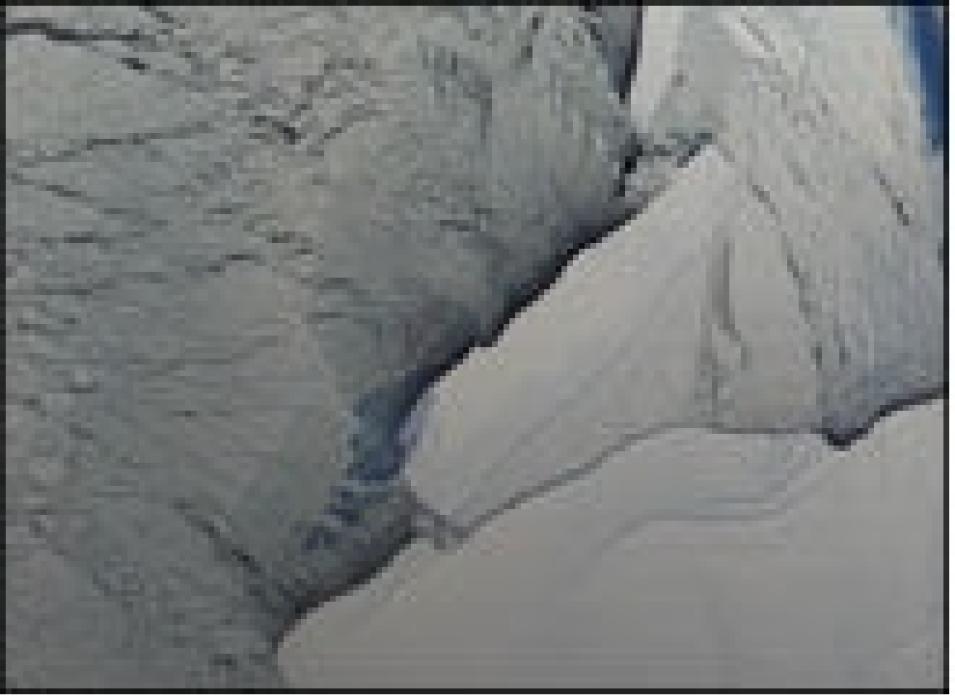
icebergs Ross Ice Shelf
Image Caption

Icebergs break away from the Ross Ice Shelf in Antarctica on September 21, 2000.

"MODIS allows us to map subtle features in detail," said Ted Scambos, a research scientist at the National Snow and Ice Data Center Distributed Active Archive Center (NSIDC DAAC) and co-investigator with Fahnestock. "Records of events that we thought were too old to see any more, such as flow stripes on older parts of glaciers that ceased flowing more than four or five hundred years ago, are still visible in MODIS imagery as very faint topographic undulations."

The Ross Ice Shelf, a huge plate of floating ice attached to the Antarctic ice sheet, is surrounded by one of the world's most dynamic glacier systems. The thick ice of the West Antarctic ice sheet allows geothermal heat from the ground below to raise temperatures at the base of some ice patches to slightly above the melting point. Melted regions are organized by flow into ice streams. Friction, caused by ice movement, melts more ice at the stream base, allowing the ice to move rapidly. Rapidly moving ice streams may slide as much as 500 meters per year.

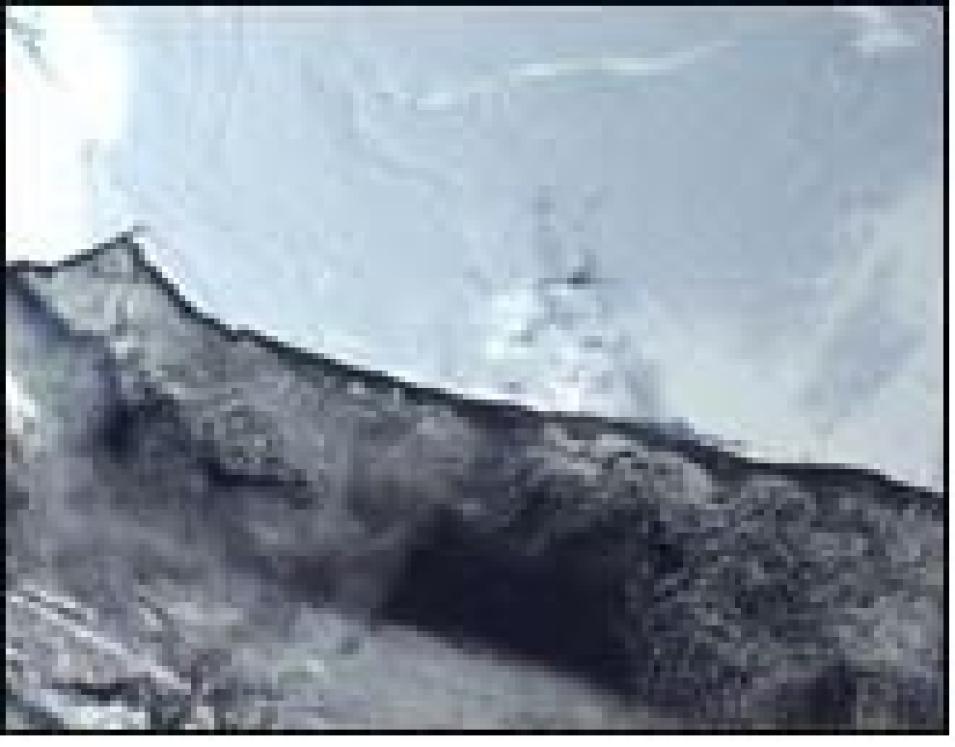
Ross Ice Shelf B15 calving
Image Caption

Taken on March 3, 2000, this image shows the Ross Ice Shelf prior to the calving of iceberg B15.

"In the past thousand years, several ice streams have started up, drained certain areas and then shut down," said Fahnestock. "Parts of streams have frozen to the bed, gotten stuck, and forced ice upstream to flow around these areas. The record shows that in some cases these areas are reintrouduced to the stream, and in other cases they remain stuck to the bed and are left behind as the ice stream thins."

As ice streams flow out across the Ross Ice Shelf they leave a trail of flow lines that in satellite imagery, look like strands of hair or fingernail ridges. The ridges are subtle, often no more than a half-meter in height and several kilometers wide. If changes occur near the grounding line, the region where ice begins to go afloat, the flow lines may shift and turn. Over time, the ice flow carries the record of these changes to the front of the ice shelf.

MODIS' sensitivity to small variations in reflected light facilitates researchers' ability to track subtle ridges left by slight changes in flow pattern. Each image contains the digital equivalent of thousands of shades of gray, providing impressive contrast that highlights subtle ice sheet attributes, including ancient flow shear margins, flow stripes and undulations in the ice. (MODIS data are available from the Goddard DAAC; MODIS snow and sea ice products and AVHRR data for the polar regions are available from NSIDC DAAC in Boulder, Colorado.)

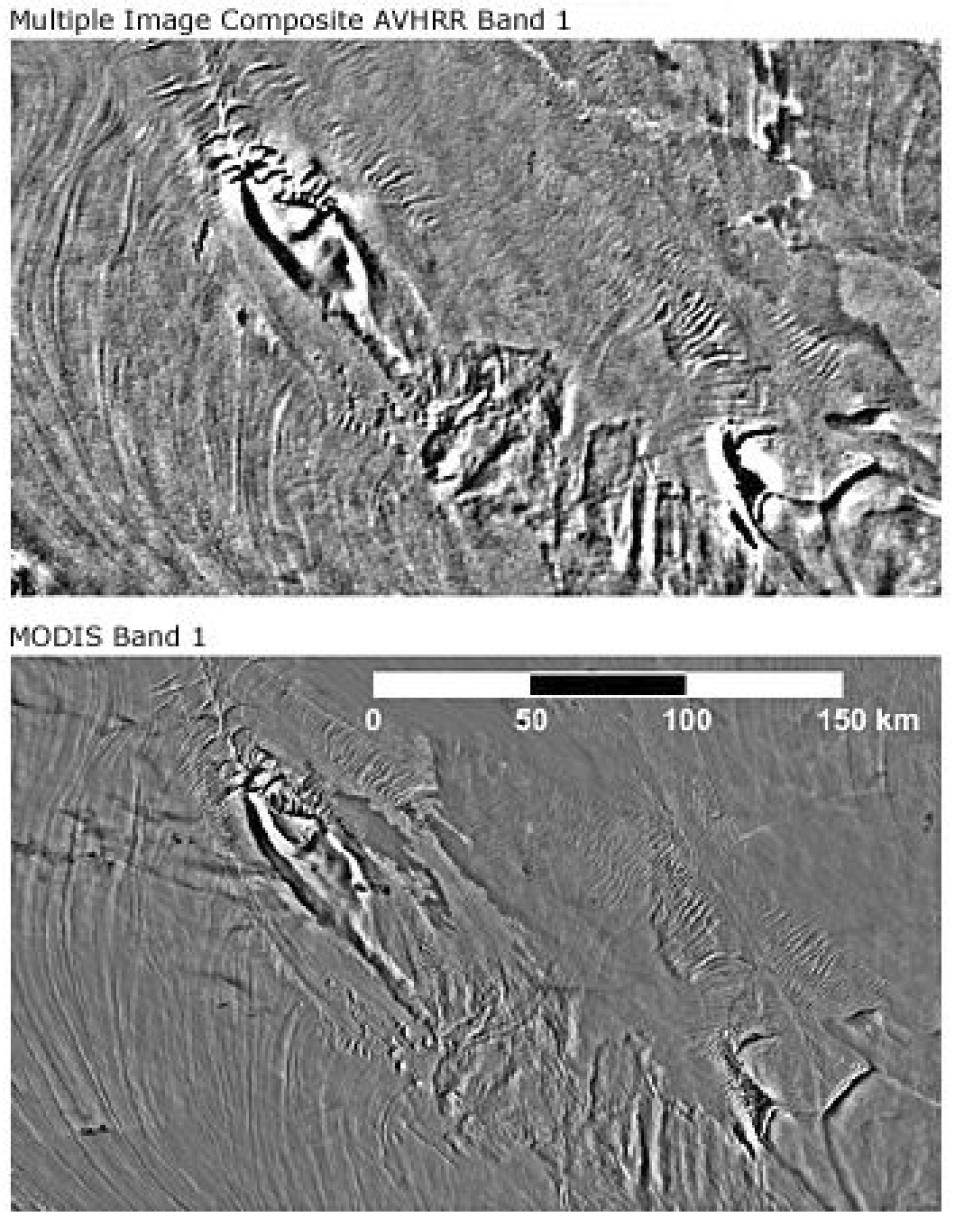
AVHRR MODIS comparison
Image Caption

MODIS offers much finer detail than previous sensors, as this comparison of a multiple composite AVHRR image (top) and MODIS (bottom) shows. (Images courtesy of Mark Fahnestock, University of Maryland).

"MODIS takes an image of the same area at high latitude about once every 100 minutes. Like AVHRR, it is sun synchronous and orbits the Earth about 14 times per day, taking up to eight images of the same area, depending upon the latitude. Overlap increases at high latitudes. By combining images from three or four orbits, we can see flow stripes through their entire path," Fahnestock said.

"The sun's aspect and angle change with consecutive orbits, so changes in illumination allow us to see subtle slope differences on the ice sheet surface," said Scambos. "The surface doesn't change quickly so we only need a few cloud-free images for our research. We typically select images taken in the spring when the air is clear, cold and dry, and before surface melt begins. In spring the low sun elevation provides as great a variation as possible in surface brightness levels."

In a 2000 study, Fahnestock, Scambos, and their collaborators used AVHRR and Landsat imagery to map ice flow history along Antarctica's Siple coast by looking at ancient flow lines and rifts in the ice. Using MODIS' more detailed imagery, they hope to refine this history, and use it as a guide to predict what will happen in the area over the next 1,000 years.

"Our best initial guess is that similar processes to those that occurred in the last 1,000 years will continue. If we get a good characterization of what's happened in the past 1,000 years then we've got a road map for the next 1,000 years. If anything changes relative to this, we'll be surprised — and perhaps be able to interpret it as something related to, for example, climate change," Scambos said.

"MODIS imagery will also be used to complete a Landsat map of Antarctica," said Fahnestock. "MODIS' visible imagery will fill in the information around the pole where Landsat can't capture images because of its satellite orbit. The National Science Foundation recently funded Christina Hulbe, a research scientist at Portland State University, and me to determine how ice stream flows are changing. We know that a number of the ice streams have slowed down in parts and that the flow patterns are changing. The MODIS imagery lets us make arguments about the causes of active flow changes and will help determine whether this process repeatedly occurs on the ice sheet as it gets smaller and smaller."

References

Fahnestock, M.A., T.A. Scambos, R.A. Bindschandler, G. Kvaran. 2000. A Millennium of Variable Ice Flow Recorded by the Ross Ice Shelf, Antarctica. Journal of Glaciology. 46(155):652-664.

For more information

NASA National Snow and Ice Data Center Distributed Active Archive Center (NSIDC DAAC)

About the remote sensing data used
Satellite Landsat Terra
Sensor AVHRR MODIS
Parameter Antarctic topography and ice history Antarctic topography and ice history
DAAC NASA National Snow and Ice Data Center Distributed Active Archive Center (NSIDC DAAC) NASA Goddard Earth Sciences Data and Information Services Center (GES DISC)

Details

Last Updated

Published

Data Center/Project

Goddard Earth Sciences Data and Information Services Center (GES DISC)
National Snow and Ice Data Center DAAC (NSIDC DAAC)