A biomass map of Africa
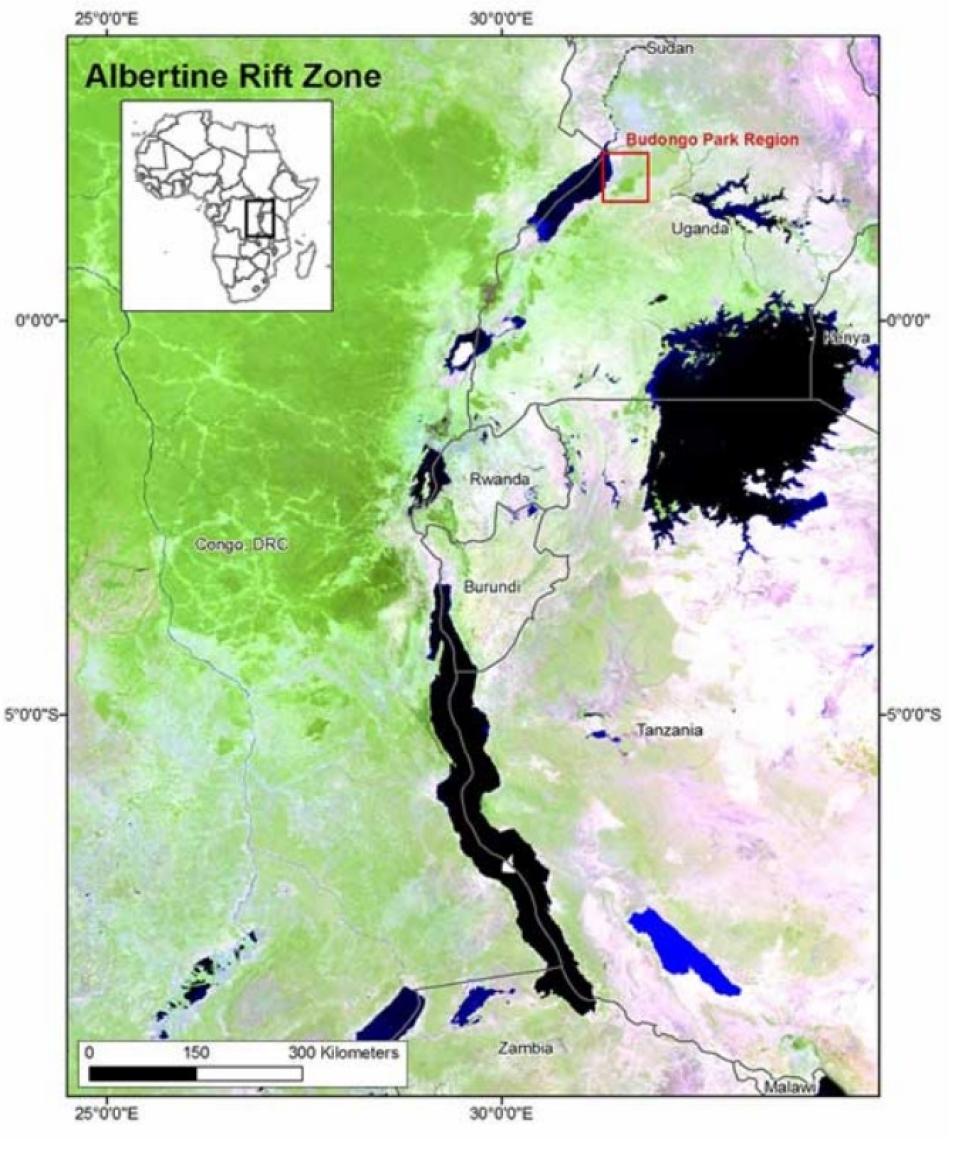
In the spring of 2005, Laporte accepted an invitation to visit Uganda's National Forest Authority. While there, she learned that the Ugandans were trying to use maps of the forest's biomass—trees, plants, and other living matter—to help them manage the land use of their forests. "By law, the government of Uganda must come up with an estimate of the forest biomass every five years," Laporte said. On-the-ground field surveys are expensive and time-consuming, so the Ugandans had turned to satellite imagery, also called remote sensing data, as a logical solution for creating a map. "But the last time they produced a map," Laporte said, "they used high-resolution satellite imagery and it took them almost ten years to produce." Laporte thought she knew why.
The satellite imagery the Ugandans used is called Satellite Pour l'Observation de la Terra (SPOT) data. The SPOT sensor collects data at a resolution of two-and-a-half to twenty meters, and its image footprint covers areas measuring sixty kilometers by eighty kilometers (thirty-seven miles by fifty miles). "It's like covering the whole country with hundreds of little tiles that you have to put together," Laporte said. "It's very time consuming to do that, especially with limited resources."
Laporte knew of another option: data from the Moderate Resolution Imaging Spectroradiometer (MODIS) sensor, flying aboard NASA's Terra satellite. MODIS data are distributed by NASA's Land Processes Distributed Active Archive Center (LP DAAC) at the United States Geological Survey's Earth Resources Observation and Science (EROS) Data Center in Sioux Falls, South Dakota. The data have a lower resolution than SPOT data; the specific data set that Laporte used has a resolution of one kilometer (six tenths of a mile). However, MODIS data are organized in large tiles that cover entire regions, so MODIS data were a more manageable choice for the project. The Ugandans welcomed Laporte's help and expertise. Laporte said, "For all of Uganda, we only had to process two giant tiles from MODIS instead of hundreds of tiny tiles from SPOT."
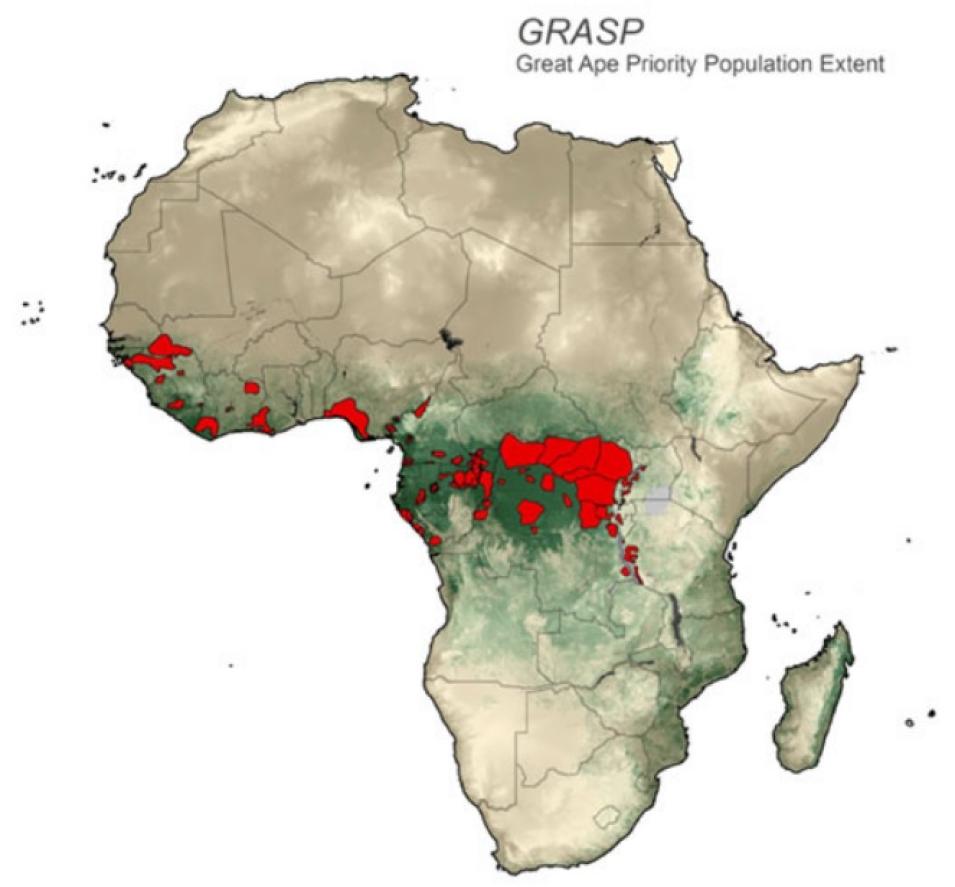
Laporte realized that the biomass map that the Ugandan government needed for forest management was actually one piece of a much larger puzzle. "The same remote sensing data sets can have different applications according to the question you want to answer," she said. She decided to propose an expanded version of the Ugandan biomass-mapping project to NASA through its Land-Cover Land-Use Change and Biodiversity and Ecological Forecasting programs. Laporte knew that the biomass project would be more useful if it extended to all of Africa rather than just focusing on Uganda. She also recognized that the biomass map of Africa could be used to seamlessly address multiple needs at the same time: quantifying CO2 emissions, helping conserve the Great Apes, and improving forest management.
Quantifying carbon dioxide emissions
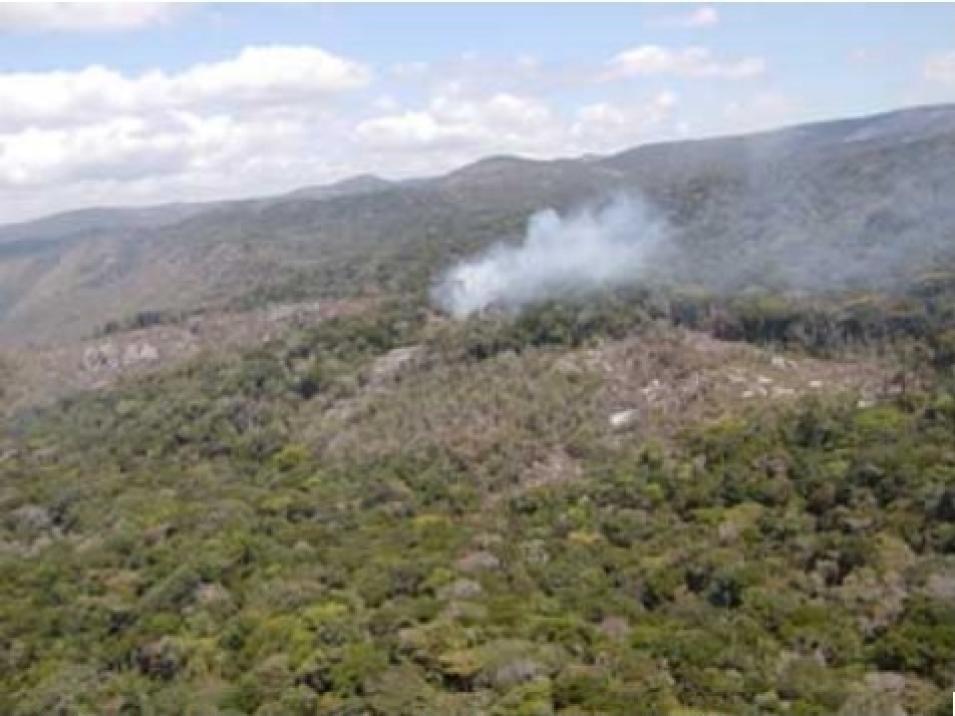
When a farmer burns a patch of forest, carbon stored in the trees and forest biomass returns to the atmosphere as CO2; this exchange of carbon between the Earth and the atmosphere is called the carbon cycle. By changing its land use, the forest patch goes from being a "carbon sink," which stores carbon, to being a "carbon source," which gives off CO2. Different countries produce different amounts of CO2, depending on various factors, including the amount of forest that is burned within their borders. However, the amount of carbon released into the atmosphere also varies depending on the type of forest burned. Evaluating the forest types of Central Africa is one of the main goals of the Africa biomass map project.
Alessandro Baccini, a remote-sensing scientist at Boston University who is collaborating with Laporte on the biomass map, explained the reason that different forests store differing amounts of carbon. "If you log a young forest, the amount of carbon released may not be very big," he said. "But if you log a mature forest, the amount of carbon released is probably much higher because the trees are taller and have a larger diameter." So, if scientists assume one average biomass amount for an entire country or region, their carbon estimates probably will not be accurate.
Laporte said, "That is why it's important to know the type of forest. Using MODIS imagery, we can determine the biomass of particular forests; then we know how much CO2 is released when those forests are burned." However, to effectively use satellite imagery to estimate the biomass that a forest represents, scientists first need some sample field data to check against. Baccini said, "We need to know how much biomass we have on the ground in a particular spot. Then, using this field data, we can calibrate the relationship between actual biomass and the remote-sensing data."
Richard "Skee" Houghton, a carbon modeler at the Woods Hole Research Center and collaborator on the project, agreed. "We're going to try to link the land-use change finely enough in space, at a specific location, to attach a biomass to it. That's what makes this map so much more difficult to produce, and it ought to be that much more accurate, too."
Once Laporte and Baccini have produced the biomass map and checked its accuracy, Houghton will use the information to model, or predict, the sources and sinks of carbon in Africa's forests. "The model is based on the processes of disturbance and recovery," Houghton said. "It tells us that if you cut down a particular area of rainforest, here's how much carbon was held in the rainforest, here's how much carbon would be held in a field of shifting cultivation, and here's how much carbon was released to the atmosphere when the forest was cleared." The model will be comprehensive enough to account for different land-use changes, including whether the forest is cut down for building materials, burned and farmed, or even replanted.
