Land Matters

Satellite data help the ISLSCP with storm predictions.

Storm-related losses from the 1982-83 El Niño cost the state of California an estimated $2.2 billion. Fifteen years later, damages from the 1997-98 El Niño cost California only half that amount. Differences in storm intensity and duration accounted for some of the reduced costs, but other factors were also at work.

In anticipation of the 1997-98 El Niño, the U.S. Federal Emergency Management Agency spent approximately $165 million to prepare for storms and heavy rain in California. Local governments distributed sandbags to residents for flood protection, established volunteer programs to remove debris from storm drains, monitored high flood risk areas, and provided special training to damage-control teams.

All of this preparation was possible because the 1997-98 El Niño had been forecast six months in advance.

“The ability to predict El Niño events has improved enormously over the past five to 10 years,” said Pavel Kabat, professor in climate hydrology at Wageningen University in the Netherlands. Kabat, who is the science chair for the International Satellite Land Surface Climatology Project (ISLSCP), thinks an important reason for the improved predictions is the incorporation of information that, until recently, had been largely ignored.

Thistle Utah El Nino
Image Caption

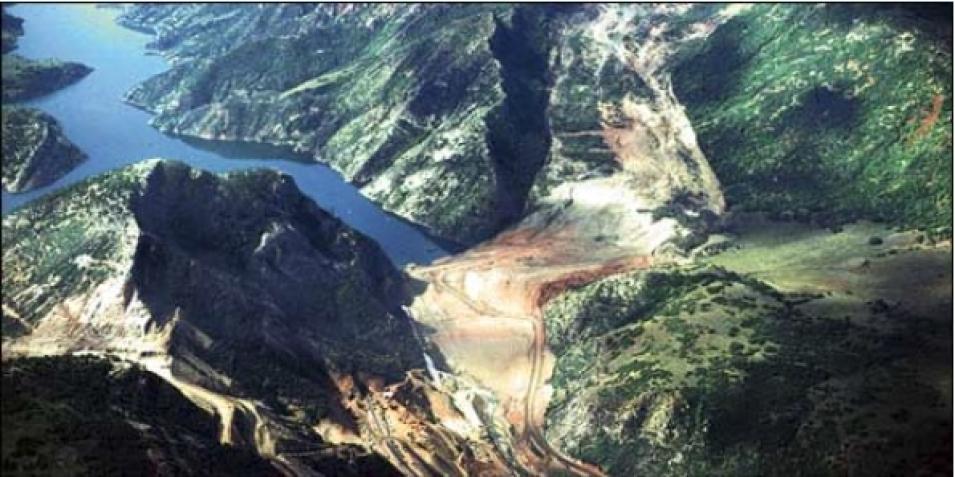
Effects of the 1982-83 El Niño extended far inland. Unusually heavy precipitation in Utah caused a landslide near the town of Thistle that has been described as the most expensive single landslide in U.S. history. Image courtesy of the Geology and El Niño in the Desert from the USGS.

“Ten to 15 years ago, the climate modeling community was working with global models that used only ocean and atmosphere data,” Kabat said. “At that time, the community believed the climate system was driven by just those two components. Five to seven years ago, some of the largest climate centers began incorporating vegetation data into their models, but they were assuming only one vegetation type per continent. All of Europe, for example, was classified as having one vegetation type. Slowly but surely, ISLSCP has helped climate modelers recognize the importance of accurate data for land components. That was not the case 10 years ago, but now it’s widely accepted.”

Established in 1983 under the United Nations Environment Programme, ISLSCP promotes the use of satellites to develop data sets of land surface parameters for use in climate models. Forrest Hall, senior research scientist at the University of Maryland Joint Center for Earth Systems Technology, is the principal investigator in this project. “One element of ISLSCP involves very large-scale field experiments to develop and test our methods for understanding the Earth’s ecosystems and how they interact with the atmosphere to influence climate. Another important aspect is taking measurements in the field to validate satellite data,” he said.

The First ISLSCP Field Experiment took place on the Konza Prairie in Kansas between 1987 and 1989 and provided satellite-derived data on land-surface states and processes. Building on that work, the Boreal Ecosystems-Atmosphere Study examined the Canadian boreal forest from 1994 to 1996.

ISLSCP has progressed in stages, consisting of three different initiatives. In 1995, Initiative I published CD-ROMs of global land cover, soil, hydrometeorology, and radiation data. “Climate modelers typically use a latitude/longitude grid, and the ISLSCP data are all in a consistent grid format,” said Richard Armstrong, an ISLSCP researcher and senior research scientist at the National Snow and Ice Data Center, one of NASA’s Distributed Active Archive Centers (DAACs). The Initiative I data sets cover a two-year period, 1987 and 1988, but the longer the time span, the greater the benefit to the models. “It’s good to look at data covering at least 10 to 20 years,” said Armstrong.

Due for release in 2003, Initiative II has expanded coverage, with data spanning at least 10 years (1986 to 1995) and even longer for selected data sets. Initiative II also improved on the spatial and temporal resolutions of Initiative I and used updated algorithms.

“Initiative III will pick up where Initiative II left off,” Hall said. “First, we’ll extend it in time through 2007. Second, we’ll add new data sets that have just recently become available as a result of new satellites or new analysis techniques. Finally, we may go back and reprocess some of the Initiative II data sets with newer algorithms.”

Continual improvements to data sets and algorithms may sound excessive, but the satellite record spans only 30 years, and scientists are just beginning to understand all the factors that affect global climate change. “We often don’t have much luck predicting the weather five days out,” said Armstrong. “Climate modeling and prediction is still a pretty new field.”
Landsat Prince Albert
Image Caption

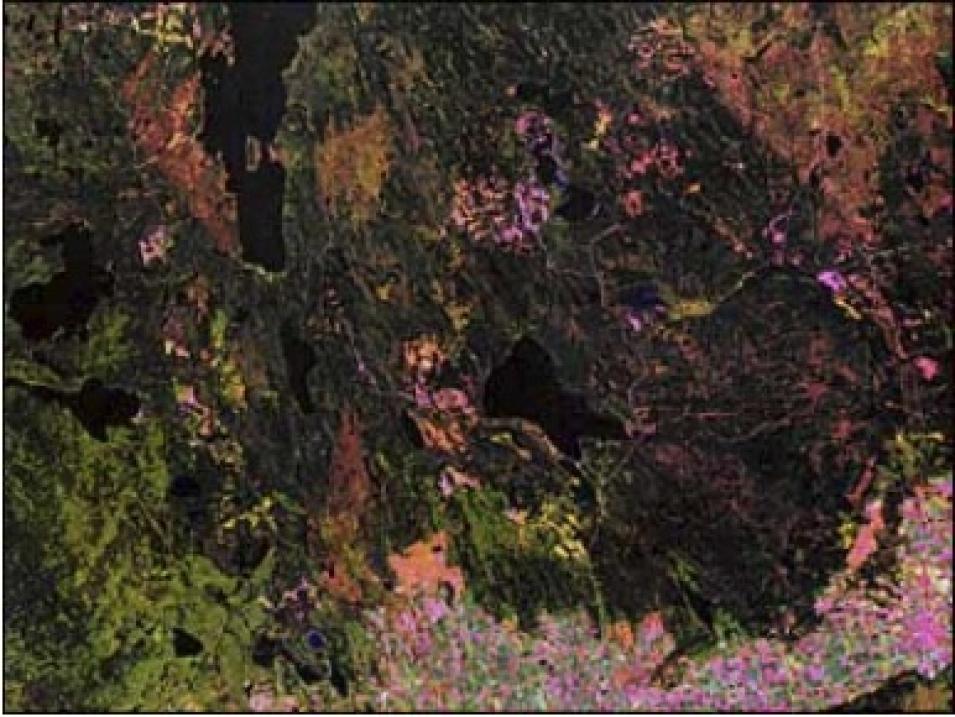
Landsat captured this image of the region around Prince Albert, Saskatchewan in 1990. This was the Southern Study Area in the BOREAS Project field campaigns of 1994 and 1996. Image courtesy of the BOREAS Information System.

Kabat recalled an early ISLSCP experiment. “It was a very short time scale, just a couple of weeks. This was partly because of the cost, but also because we hadn’t realized by that time how important the living biosphere actually is to climate studies,” he said. Researchers and climate modelers have improved their validation efforts over the years by recognizing the need to spend enough time in field validation and by monitoring different sites at different times. “In the Sahel, the vegetation growth happens within a three- to five-month time period each year, so it doesn’t matter if you stay there beyond that because nothing really happens,” said Kabat. “But when you’re in Europe or the central United States, you really need to spend a whole year monitoring the area. The conditions in the winter, spring, summer, and fall are all different.”

Accurate climate models can benefit millions, through better predictions of severe weather events like El Niño to more astute monitoring of scarce resources. “If you look around the world and identify resources that are important for the sustainability of the region, water is always crucial. Yet in some regions, it’s more critical than in others,” said Kabat. “Some sectors of the society are more dependent on accurate predictions of water resources or precipitation. To plan effectively for a shortage, they would ideally have that information six months to one year ahead.”

An example of how ISLSCP field experiments have improved weather forecasts comes from the ISLSCP field experiment in Kansas. “In the Kansas experiment we learned that operational weather models didn’t correctly predict the impact of stored soil moisture on the weather machine. Model forecasts of a 1993 spring flood in Minnesota were off by several hundred miles. In fact, heavy rains inundated Missouri, catching emergency officials off guard and causing hundreds of millions of dollars in damages that might have been prevented by earlier accurate forecasts,” said Hall. “ISLSCP data led to corrections in the model with significantly improved operational forecasts, which has potentially huge benefits to aviation and agriculture.”

Better climate models may help researchers more accurately predict Earth’s long-term changes as well. To understand these changes, ISLSCP activities focus on uncovering the exchange of energy, water, and carbon between Earth’s land and atmosphere.

In recent years, the carbon cycle has been the focus of considerable scientific study and debate. Carbon is amazingly diverse. Pure carbon can form something as hard as a diamond or as soft as graphite (pencil lead). Carbon can reside in the tissues of living and dead organisms, in soil, in oceans, and in the atmosphere. Depending on the form it takes and where it resides, it has an enormous impact on Earth’s climate. “Humans put about 7 gigatons of fossil fuel into the air each year. About half of the carbon dioxide we put into the atmosphere is re-absorbed by the oceans and the land surface,” said Hall. “The northern latitudes have been taking up carbon since the last ice age. An enormous amount of carbon is stored in the soil in the form of peat.”

Mosquito arthropod
Image Caption

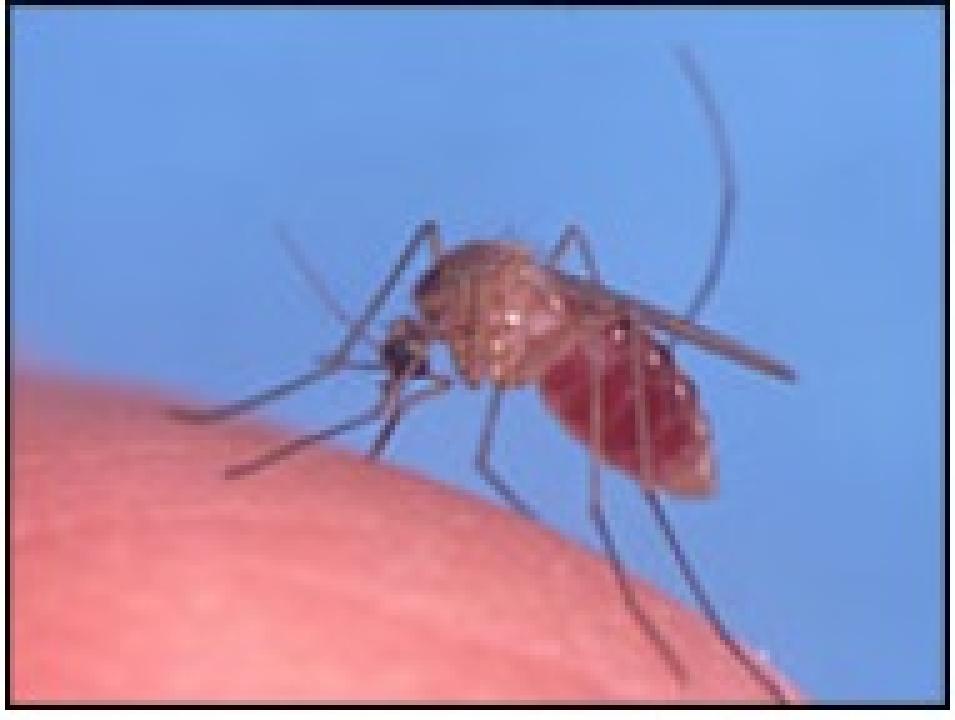
Changes in vegetation can affect disease-carrying arthropods like mosquitoes, and some researchers have used ISLSCP data sets to make predictions about vector-borne diseases. Image courtesy of West Nile Virus is on the Move from the USGS.

Soils that can absorb carbon act as carbon sinks. “The land surface and the oceans perform a real service for us,” Hall said. “They mitigate the effects of fossil fuel emissions and slow climate warming. But we need to know where those sinks are, what’s causing them, and how long they may continue to take up carbon dioxide, because some sinks are probably sensitive to climate change. If we begin to dry and warm the climate — and we know this is happening at northern latitudes — we could start warming these large peat bogs and releasing carbon into the atmosphere very rapidly.”

Should this happen, reduced ice and snow cover would also play a role in global change. Because it is white, snow reflects sunlight back into Earth’s atmosphere. As snow melts, darker soils underneath absorb, rather than reflect, heat from the sun. “Climate is also affected by glacier coverage and freshwater melt that drains into the oceans at northern latitudes. Freshwater melt can affect ocean circulation patterns and, potentially, the Gulf Stream,” said Hall.

Beyond the use of fossil fuel, human impact on the environment can be substantial, especially in the form of changes to the land surface. To better understand human factors, ISLSCP includes population data sets.

In addition to helping with long-term predictions of climate change, improved models may help health officials better monitor vector-borne diseases. Vegetation, for example, significantly affects mosquito populations, including bugs carrying harmful diseases. “People have used ISLSCP’s land surface records from the Advanced Very High Resolution Radiometer to study regional patterns of tropical diseases and their dependence on climate variation,” said Hall.

ISLSCP global sea ice
Image Caption

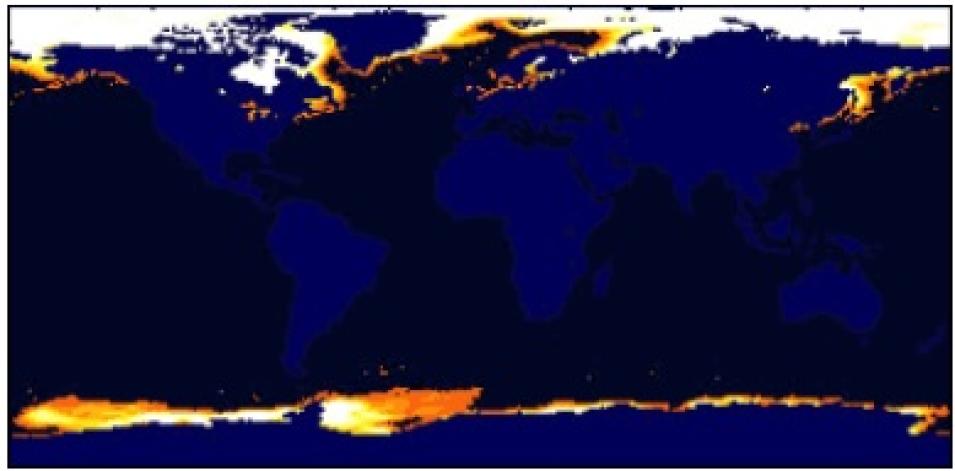
Scientists, educators, and students can use ISLSCP data sets to make animations of shortwave radiation, precipitation, vegetation changes, and other factors. This image is of global sea ice. Image courtesy of the ISLSCP Initiative II.

Scientists aren’t the only ones using ISLSCP data sets. “Middle schools, high schools, and colleges have used ISLSCP data,” said Hall. “You can make animations with the data sets and look at radiation and meteorological patterns, global vegetation, and precipitation.”

The ISLSCP data sets are available from NASA's Goddard Earth Sciences Data and Information Services Center (GES DISC) and incorporate data holdings from a variety of existing data sources. “Users have ordered over 13,000 CD-ROMs and downloaded over 267,000 files from the Web site,” said Hall. In November 2001, the Global Energy and Water Cycle Experiment, of which ISLSCP is a part, reported more than 5,000 citations in scientific literature of ISLSCP data or research. Hall explained that the ISLSCP Initiative III is designed to build on this success. “We will be acquiring data sets on fossil fuel utilization, population change and its distribution in time, and agricultural productivity. We will also have all the standard data sets: the climate record, the satellite record of land surface change over a number of years, and surface temperature records.”

“ISLSCP is sort of at the beginning of the process of understanding climate,” said Kabat. “Our goal is to provide data, often on a daily basis, for the climate modelers to try. We also want to see the benefits of the improved predictions for the communities that are affected: water managers, planners, local governments, and the people who live there.”

References

ISLSCP builds on success. GEWEX News. 11(4):3.

P. J. Sellers, R. E. Dickinson, D. A. Randall, A. K. Betts, F. G. Hall, J. A. Berry, G. J. Collatz, A. S. Denning, H. A. Mooney, C. A. Nobre, N. Sato, C. B. Field, A. Henderson-Sellers. 1997. Modeling the exchanges of energy, water, and carbon between continents and the atmosphere. Science. 275(5299):502-509.

For more information

NASA Goddard Earth Sciences Data and Information Services Center (GES DISC)

NASA National Snow and Ice Data Center Distributed Active Archive Center (NSIDC DAAC)

International Satellite Land Surface Climatology Project (ISLSCP II)

Global Energy and Water Cycle Experiment (GEWEX)

About the remote sensing data used
Satellites multiple
Sensors Satellite Imagery Field Observation
Parameter climate modeling
DAACs

NASA Goddard Earth Sciences Data and Information Services Center (GES DISC) NASA National Snow and Ice Data Center Distributed Active Archive Center (NSIDC DAAC)

Details

Last Updated

Published

Data Center/Project

Goddard Earth Sciences Data and Information Services Center (GES DISC)
National Snow and Ice Data Center DAAC (NSIDC DAAC)