Glaciers—accumulations of ice and snow that flow slowly over land—cover an estimated 700,000 square kilometers (270,000 square miles) of the Earth’s surface. Most are found near the poles with the majority residing in Antarctica, but glaciers exist on all the world’s continents except Australia.
GLIMS Database Advances Glacier Monitoring from Space
This ASTER false color image (which combines visible and near-infrared wavelengths) shows the San Quintín Glacier, the largest in southern Chile’s Northern Patagonia Icefield, and its iceberg-strewn lakes. Vegetation appears red, lakes and rivers appear dark gray, and the glacier appears white. The terminus locations are after Masiokas et al. (2020) and Winchester and Harrison (1996). Credit: ASTER/ GLIMS
According to the National Snow and Ice Data Center (NSIDC) in Boulder, Colorado, there are more than 200,000 glaciers around the globe. Glaciologists map and monitor them for a host of reasons, including the assessment of global and regional climate trends, hazard risk detection, sea level rise, freshwater resources, and ecosystem health and stability. Aiding them is the Global Land Ice Measurements from Space (GLIMS) initiative’s Glacier Database, a global inventory of land ice, including surface topography, a measure of glacial change.
GLIMS data are distributed through NASA’s NSIDC Distributed Active Archive Center (NSIDC DAAC) and made available to end users via the GLIMS Glacier Database, managed by Bruce Raup.
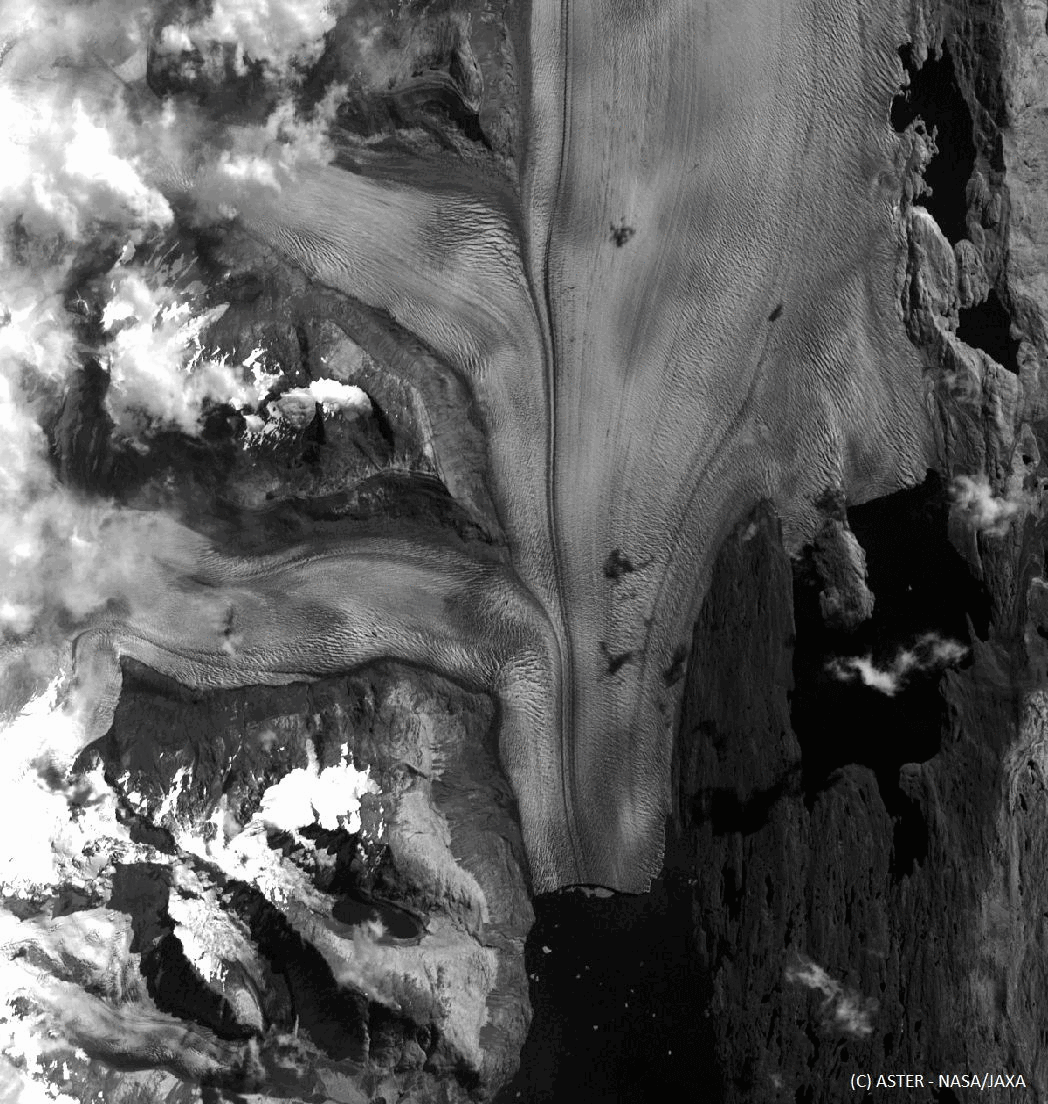
ASTER: “A Unique Workhorse”
GLIMS was designed to use data primarily from the Advanced Spaceborne Thermal Emission and Reflection Radiometer (ASTER), one of five instruments aboard NASA’s Terra satellite. ASTER is unmatched in its ability to provide free topographical information. In addition to ASTER, GLIMS incorporates data from the Enhanced Thematic Mapper+ (ETM+) instrument aboard the joint NASA-USGS Landsat series of satellites, from many other satellites, and from historical observations from the air and ground.
ASTER is a cooperative effort between NASA and Japan's Ministry of Economy Trade and Industry (METI). It is a 14-channel imaging instrument with three optical subsystems: a shortwave infrared (SWIR) radiometer that, prior to its failure in 2008, acquired images in 6 bands with a 30-meter (m) spatial resolution; a thermal infrared (TIR) radiometer for thermal imaging using 5 bands with a 90 m resolution; and a visible and near-infrared (VNIR) radiometer that acquires images in three bands with a 15 m resolution. An additional backward-looking band allows the instrument to capture stereo imagery, from which topographical information can be determined.
ASTER has been circumnavigating Earth in near-polar orbit since Terra launched in December 1999. During those 25 years in space, ASTER has amassed an archive of more than 4.5 million 60 x 60 km images, covering most land areas on Earth at different times of year, including its glaciers. In addition, the ASTER mission provides 11 data products, including a Digital Elevation Model (DEM), which covers land surfaces between 83° North and 83° South and is produced through the automated processing of scenes in the ASTER archive.
“ASTER has proven to be a unique workhorse,” said Dr. Jeffrey Kargel, Senior Scientist at the Planetary Science Institute in Tucson, Arizona, and GLIMS co-founder. “There are other satellites out there that provide stereo imagery and DEMs, but ASTER was the first optical camera to do it around the globe and to make the data freely publicly available."
Before ASTER, the Switzerland-based World Glacier Monitoring Service (WGMS) and its precursor, the International Glacier Commission—established in 1894—had a century of field-based measurements for a few dozen glaciers around the world. “WGMS data showed that almost every glacier being monitored manually in the field was receding,” Kargel said. “This seemed to fit in with the scientific understanding of the world's atmosphere-glacier system processes. It was recognized that glaciers, which can take a long time to respond to climate signals, had been melting, in part, due to climate fluctuations that occurred at the end of the little Ice Age, as early as the 1600s.”
In addition to acknowledging the impact of such natural climate shifts, glaciologists of the late 19th and early 20th century knew that human activity could also affect Earth’s climate. “They recognized as back as far back as the 1850s that carbon dioxide had heat trapping qualities, and by the 1880s-1890s they acknowledged that the burning of coal and wood in industrial processes was increasing the amount of carbon dioxide in the atmosphere,” said Kargel. “They knew that, over time, the increased amount of carbon dioxide would prevent the Earth from going into another Ice Age. This was considered a good thing.”
However, as scientists learned that the amount of carbon dioxide in the atmosphere was increasing much faster than anticipated, concern about its effects grew. By 1980, scientists projected that the elevated levels of atmospheric carbon dioxide could warm the planet and especially the Arctic Ocean, unsettling the polar climate, and, eventually, alter the global climate. These projections contributed to the birth of GLIMS.
“Dr. Hugh Kieffer of the ASTER Science Team was aware of all this—the WGMS’s observations, the theoretical understanding about melting glaciers, and the fact that the Earth’s climate was already changing by the early 1990s—and he thought ASTER could be used to monitor and detect change in Earth’s glaciers,” Kargel said. “And so, we developed GLIMS.”
Once in orbit, ASTER began sending home images of Earth’s surface, including hundreds of thousands of glaciers, and monitoring changes due to agriculture, road and dam construction, urbanization, flooding, coastal change, or glacier change. By repeatedly imaging nearly every glacier, GLIMS created a detailed, worldwide, 25-year record of glacier length and area, showing extensive retreat.
In a paper published in Global and Planetary Change, Stephan Harrison, a geomorphologist at Exeter University who worked at San Quintín Glacier, observed that, “In 1993, the glacier was advancing into the forest, and I saw ice where now there is a big lake. A small warming event that ended the Little Ice Age started the glacier's retreat around 1870, but in the 20th century it restabilized.”
While ASTER imagery was sufficient to document glacial retreat, in the early years of GLIMS, Kargel and his colleagues doubted the instrument would be able to provide accurate measurements of glacier mass balances, a key indicator of glacier sustainability.
"We thought the ASTER DEMs would allow us to get the length and area, topography, the slopes, the mean elevation, and the elevation of the toe of the glaciers, but we didn't believe that it was possible to get accurate changes in [surface] elevation,” said Kargel. “We thought the uncertainty in the vertical elevation measurements would be too high.”

This animation of ASTER and Sentinel-2 imagery shows the retreat of the Upsala Glacier in Argentina between 2003 to 2024. Image courtesy of Etienne Berthier.
The Importance of Glacier Mass Balance
Glacier mass balance refers to the addition or loss of ice in a glacier over time. Glaciers with a negative mass balance lose more ice during warm periods than they gain during cold periods, so they shrink or recede over time. Conversely, glaciers with a positive mass balance gain more ice than they lose and grow larger over time.
Changes in the size and mass of the world’s glaciers has long been an indicator of climate fluctuation, yet monitoring glacier mass balance also shows its impact on water supplies. Fluctuations in glacier mass balance and changing amounts of meltwater supply can have a significant impact on local populations.
“[Glaciers] are like natural water towers. They store snow and ice in winter and they release water in summer as they melt,” said Dr. Etienne Berthier, a glaciologist with France’s National Centre for Scientific Research (CNRS) and a long-time GLIMS collaborator.
Eventually, researchers discovered that they could get measurements of glacier mass balance from ASTER data. “If you combine all the DEM images from the first five years into one measurement, and then do the same for years 6 through 10, you get a much cleaner measurement with much lower uncertainty,” Kargel said. “Then you can divide that measurement by the number of years and get the average change in thickness per year. Once you have that, you can make a good guess at the density of glacier ice; then you can determine its mass change.”
Such applications show the value of ASTER’s 25-year data record, said Kargel.
“With glaciers, we are really interested in the time series of mass balance—how has mass balance changed over time,” he said. “If you want to get back to the year 2000 with most glaciers, you really have to rely on ASTER.”
Furthermore, Kargel says, “The risk of glacier-related disasters imposes sharp constraints on the development of infrastructure, including roads, bridges, railways, pipelines, resorts, forestry and mining operations, and habitation.” In the regions of the Swiss Alps and High Mountain Asia, the economic impact of destroyed infrastructure and areas that remain undeveloped due to the risk of potential hazards is estimated in the billions of dollars.
“ASTER has been key to our work and its stereo imaging capability is a major aspect, definitely, but apart from that, it’s important to acquire images of a specific glacier at the right time of year, i.e., end of the summer,” said Berthier.
Berthier and his colleagues benefited from having fellow glaciologists like Kargel and Raup on the ASTER science team, as their ability to fine-tune the instrument resulted in imagery that made it easier to distinguish glaciers from the snow-filled landscape around them. Such methods as airborne and satellite laser altimetry, helped to validate the mapped glacier changes.
An example of an ASTER derivative product is shown below (see the graphic of glacier surface elevation changes in Alaska). The advances of Berthier’s team in DEM generation and refinement culminated in a 2021 paper published in Nature wherein he and his fellow authors used their half a million high-resolution DEMs to document surface elevation changes at a high spatiotemporal resolution over all of Earth’s glaciers except the polar ice sheets. These changes, the authors say, reveal the accelerated patterns of glacier mass loss during the early 21st century, now contributing 21 percent of sea level rise.
These findings would not have been possible without the ASTER image archive and the Randolph Glacier Inventory (RGI), Berthier said.
“We need the glacier inventory because we need to be able to distinguish between glacial and stable (i.e., nonglacial) terrain. We need the stable terrain to do what we call the ‘coregistration’ of the elevation models to make sure the location of the stable terrain matches,” Berthier said. "That way we can have a lot of confidence in measurements we make. This is really what GLIMS provides.”
This graphic shows ASTER-based surface elevation changes (in meters/year) of Alaskan glaciers in the panhandle region near Juneau from 2000 to 2016. Dominance of reddish colors indicates that almost all the glaciers have negative mass balances: much less snow is accumulating and sticking through the summer than is melting. Credit: Berthier et al. 2018.
The contributions Berthier’s team has made to GLIMS and the worldwide glaciological community are a continuation of the international cooperation that began with the American and Japanese collaboration on the ASTER instrument. Today, this spirit of partnership and teamwork is shared by scientists from dozens of countries. Because of it, GLIMS has informed far more researchers, water resource managers, and others about the world’s glaciers than Kargel and his colleagues ever thought possible.
Resources
The entire ASTER data product archive, including the ASTER Global DEM, is available for download via NASA’s Earthdata Search and Land Processes Distributed Active Archive Center (LP DAAC).
Users can access the GLIMS data collection at NSIDC DAAC.
References
Berthier, E., Kargel, J.S., Raup, B. and Zemp, M. (2024). Correspondence: Earth-surface monitoring is at risk—more imaging tools are urgently needed. Nature, 630 (563). doi:10.1038/d41586-024-02052-x
Berthier, E., C. Larsen, W.J. Durkin, M.J. Willis, and M.E. Pritchard. (2018). Brief communication: Unabated wastage of the Juneau and Stikine icefields (southeast Alaska) in the early 21st century. The Cryosphere, 12: 1523–1530. doi:10.5194/tc-12-1523-2018
Harrison, S., Winchester, V. and Glasser, N. (2007). The timing and nature of recession of outlet glaciers of Hielo Patagónico Norte, Chile, from their Neoglacial IV (Little Ice Age) maximum positions. Global and Planetary Change, 59(1-4), pp.67-78. doi:10.1016/j.gloplacha.2006.11.020
Harrison, S., Kargel, J.S., Huggel, C., Reynolds, J., Shugar, D.H., Betts, R.A., Emmer, A., Glasser, N. Haritashya, U.K., Klimeš, J., Reinhardt, L., Schaub, Y., Wilyshire, A., Regmi, Vilímek, V. (2018). Climate change and the global pattern of moraine-dammed glacial lake outburst floods, The Cryosphere 12, 1195-1209. doi:10.1007/978-3-031-39408-9_15
Hugonnet, R., McNabb, R., Berthier, E. et al. (2021). Accelerated global glacier mass loss in the early twenty-first century. Nature, 592: 726–731. doi:10.1038/s41586-021-03436-z
Masiokas, M.H., Rabatel, A., Rivera, A., Ruiz, L., Pitte, P., Ceballos, J.L., Barcaza, G., Soruco, A., Bown, F., Berthier, E., Dussaillant, I. and MacDonell, S. (2020). A Review of the Current State and Recent Changes of the Andean Cryosphere. Frontiers in Earth Science, 8: 99. doi: 10.3389/feart.2020.00099
Rivera, A., Aravena, J.C., Urra, A., and Reid, B. (2024). Chilean Patagonian Glaciers and Environmental Change, 2024. Chapter 15 in: Conservation in Chilean Patagonia, pp.393-407. doi:10.1007/978-3-031-39408-9_15
Winchester, V. and Harrison, S. (1996). Recent Oscillations of the San Quintin and San Rafael Glaciers, Patagonian Chile. Geografiska Annaler. Series A, Physical Geography, 78 (1): 35-49. doi:10.2307/521133