Drought on the Range

Ranchers want to know what to do about dry spells.

The grassy, high plains and rolling rangelands of Texas are perfect for grazing cattle. But the specter of drought is rarely far from ranchers’ minds. Drought desiccated Texas from 2011 to 2012 so severely that many ranchers had to purchase feed and water, and truck it out to their cattle. Others chose to sell off parts of their herds well before animals reached their peak weight—and peak prices.

Although rangelands are hardy biomes that thrive in relatively dry climates, a persistent lack of water can tip them into drought, withering grasses and reducing prairies to dust. Because ranchers rely heavily on grass, they ultimately depend on water. Rain and snow are important sources, but much of that water evaporates back into the atmosphere. The remaining water either runs off into lakes or streams, or percolates down into the soil to nourish plants where their roots are, within 5 to 100 centimeters (2 to 39 inches) of the surface.

This soil moisture—or lack of it—forges a ranch’s future. “Soil moisture determines the biomass, or how much grass we’re going to get,” said Gabriel Senay, a scientist at the US Geological Survey who studies agriculture and hydrology. “And of course, the healthiness of the grass will determine how many cattle can be supported.” But soil moisture measurements that are accurate and available over broad regions have long been missing from the drought equation.
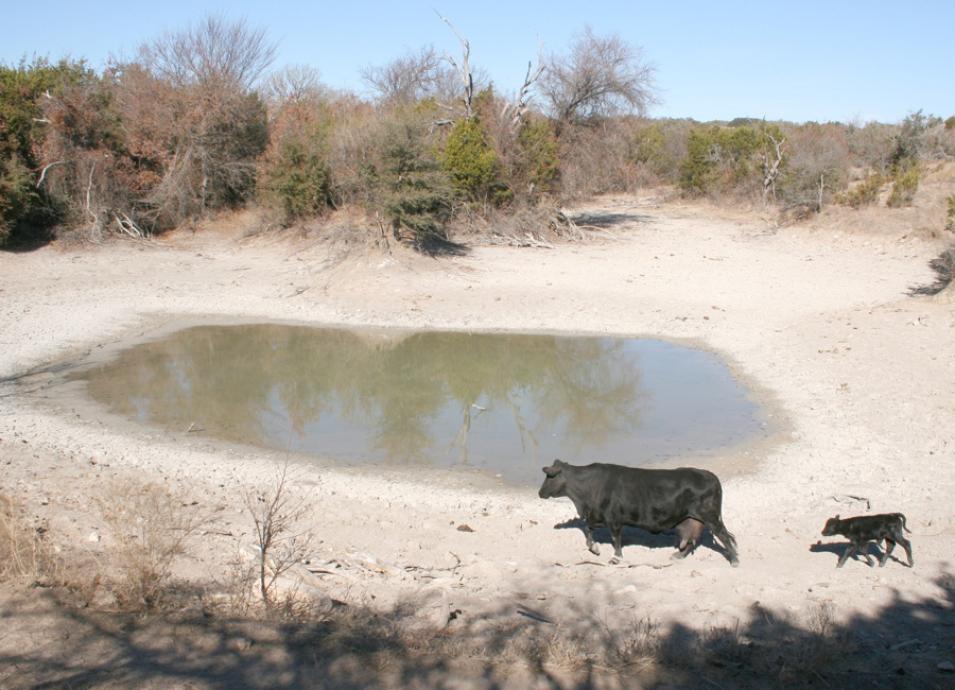
Photograph of a cow and calf near a water hole during a Texas drought
Image Caption

A prolonged drought across Texas desiccates plants and dries up livestock watering holes. (Courtesy AgriLife Today)

Sensing the missing piece

When monitoring drought, researchers like Senay use data from ground stations that record rain and snowfall rates, temperature, humidity, and evaporation. Many stations also include soil moisture sensors, slender probes plunged into the soil. These stations offer single points of data, but soil moisture can vary widely over short spaces. A shady drainage may be damper than the surrounding prairie, even if they both get the same precipitation.

Soil moisture plays a large role in a landscape’s resiliency or vulnerability. High soil moisture means more water is immediately available for growing plants, and also makes rain more likely to run off the saturated surface to fill streams and lakes, benefitting ecosystems nearby or downstream. Low soil moisture could mean the soil soaks up available precipitation, leaving nearby or downstream areas drier and vegetation more stressed.

Meteorologists and researchers feed soil moisture data into computer models to help create monitoring products and seasonal predictions. However, point measurements leave large spatial gaps in the data record. Satellite data fill in the gaps for precipitation, temperature, and other variables, but until recently, soil moisture has been difficult to detect from space.

“Soil moisture has been a dream in hydrology since the 1980s, and even earlier,” Senay said. “I remember my advisor from 20 years ago saying soil moisture is like the holy grail.” So when NASA's Soil Moisture Active Passive (SMAP) mission launched in 2015, Senay and other hydrologists were excited. SMAP works by detecting microwave radiation, which all surfaces on Earth emit in small amounts. The radiometer instrument on the SMAP satellite focuses specifically on radiation frequencies that signal minute differences in moisture on and near land surfaces. For instance, very wet surfaces, like lakes, emit low amounts of these frequencies, while a dry surface like sand will emit higher amounts.

However, can a satellite monitor soil moisture accurately enough to complement existing station data on a broad scale, and be truly useful for drought monitoring?

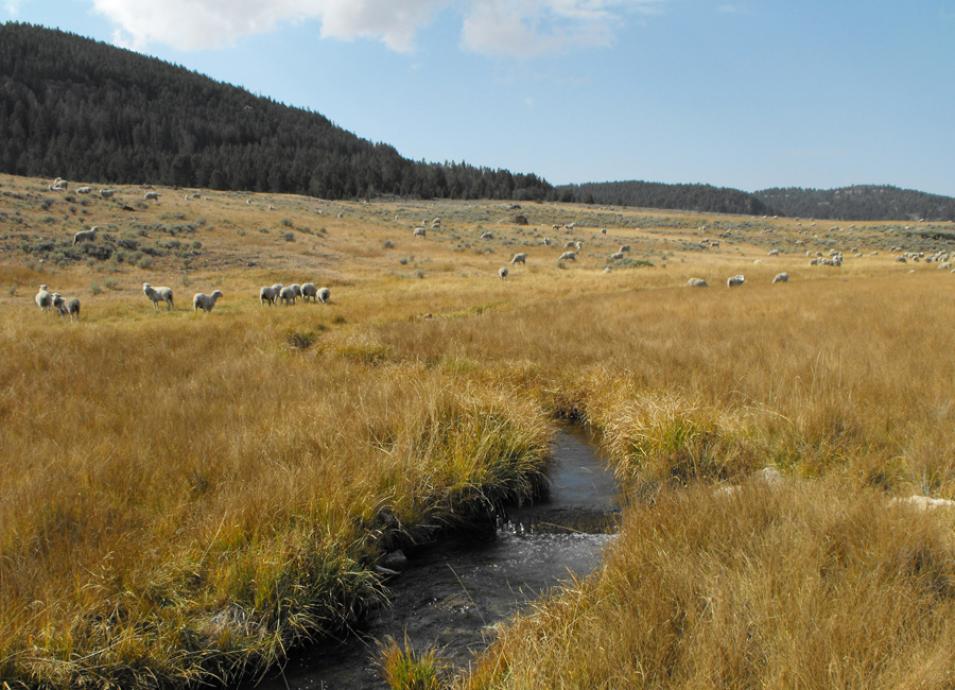
Photograph of sheep grazing on rangelands in Wyoming
Image Caption

Sheep graze on public rangelands at Beartrap Meadows in Wyoming. (Courtesy M. Wells, Wyoming Stock Growers Land Trust, US Department of Agriculture)

Soil moisture by satellite

To put SMAP to the test, Senay and his colleagues compared it to soil moisture data collected from ground stations between April and December 2015. They looked for the most applicable stations by reviewing land cover data from the Moderate Resolution Imaging Spectroradiometer (MODIS) satellite instrument. After identifying areas that contained more than 70 percent rangeland, they selected eight stations scattered across the southern Great Plains rangelands, seven in Texas, and one in the Oklahoma panhandle.

“One of the reasons we focused on Texas and Oklahoma was the availability of ground stations, which had in situ soil moisture data readily available on the Web,” Senay said. Although rangelands span much of the western United States, these stations are more common in portions of the Great Plains and in agricultural areas. For a full picture of the hydrologic cycle, Senay and his team then incorporated rainfall and surface temperature data for each site over the course of their study.

SMAP matched the ground data and models, echoing the overall variability in soil moisture over time. Likewise, the satellite data demonstrated a dry trend early in the study period that progressed into exceptional drought conditions by October. In addition, the researchers found a surprisingly useful parallel in the SMAP data. “We are getting strong correlations to deeper layers, down to 20 centimeters (8 inches), reliably, and even to 100 centimeters (39 inches) in some instances,” Senay said. SMAP is designed to measure moisture in the topmost layers of soil, about 5 centimeters (2 inches) deep. This depth captures the land-atmosphere interactions that form a large part of the hydrologic cycle. Yet the root zone of many plants extends deeper, and this is where the moisture is needed for plants to survive drought.

SMAP introduces a new and reliable source of soil moisture data, which will instill more confidence in drought monitoring and forecasting. “Drought modeling requires a convergence of evidence,” Senay said. For example, looking at soil moisture or rainfall or streamflow alone will present a lopsided and incomplete view of the hydrologic cycle. “So when at least two or three of these data sets converge, we will have more confidence in the final product,” he said.

Series of data images showing the progression of drought conditions in Texas, 2015
Image Caption

This series of maps shows soil moisture in Texas in fall 2015, during extreme drought conditions. Red indicates less soil moisture; yellow indicates higher soil moisture. Data are from the NASA Soil Moisture Active Passive (SMAP) mission. (Courtesy N. M. Velpuri, et al., 2016, Rangelands)

From soil moisture to sirloin

Confidence is one of the keys to making drought data useful for rangeland managers, ranchers, and other stakeholders. Derek Scasta is a rangeland extension specialist at the University of Wyoming, where he searches for ways to link practical science to the people it impacts. “The variability of drought, both in space and time, is really what makes it difficult to manage,” Scasta said. “And of course predicting it is the million-dollar question. If we could predict it, we could manage it a lot better.” Drought is a culmination of many factors such as rainfall, soil moisture, and temperature that are highly variable not only over time, but over space. “Sometimes drought is very localized. A rancher might have seen their neighbors get rain, while they didn’t get any,” Scasta said.

Ranchers must analyze drought forecasts to make hard decisions. The more confident they are in the data, the more confidently they can choose how to respond when a drought looms. “One of the common tools that’s used is a trigger date,” Scasta said. For instance, a rancher might choose May 15 as a trigger date. “Oftentimes that spring rain or that early summer rain can be a good predictor of forage production for the year,” Scasta said. “So if we’ve been dry, below normal that spring, we might need to make some decisions, as far as drought mitigation. If we’ve been pretty wet up until that point, we might have a pretty good production year.” Other ranchers remain perpetually prepared. “They might build in regular rest into their rotation of grazing through pastures,” Scasta said. “Some producers just build in practices to mitigate drought no matter what.”

The recent drought hit Texas farmers and ranchers especially hard, causing more than $7 billion in losses. Many still struggle to recover. Some ranchers culled their herds; others quit the ranching business altogether. And after 26 years of occupying the top spot for cattle income, in 2013 Texas fell to second place behind Nebraska, largely a result of the drought.

While the drought in Texas has ended for now, it will return, and SMAP will help improve future forecasts. One of the primary tools rangeland managers use is the US Drought Monitor run by the University of Nebraska, which is working on incorporating SMAP data. Including soil moisture data across broad expanses will more accurately reveal an ecosystem’s overall hydrology, and help indicate whether a drought may be looming. While that may come too late for those affected by the recent Texas drought, better forecasts will ultimately help ranchers prepare for drought more proactively.

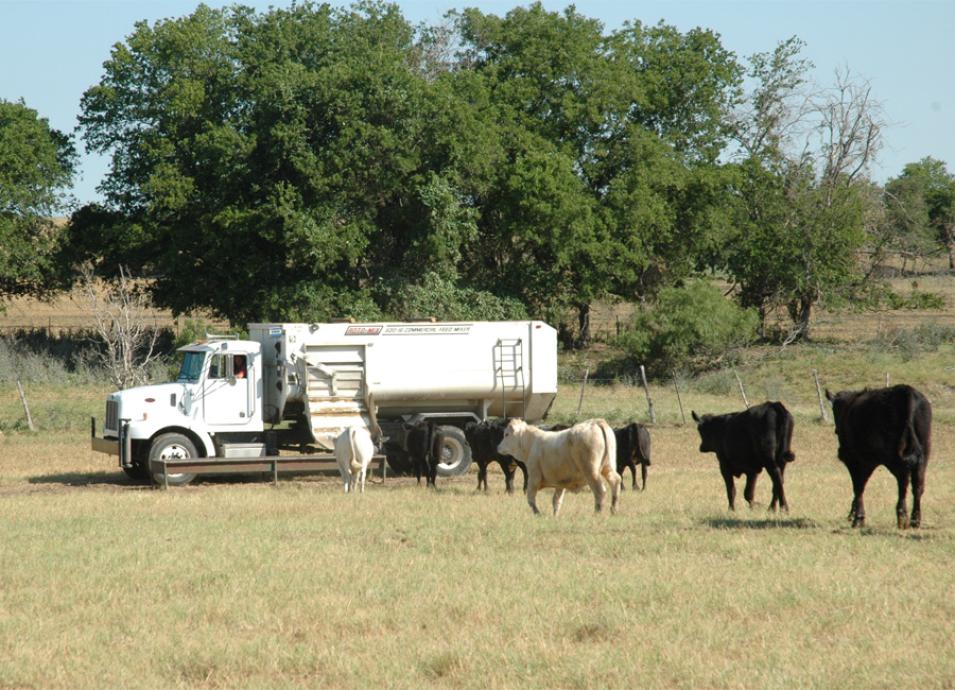
Photograph of a truck distributing feed to drought-stricken cattle in Texas
Image Caption

During the 2011 drought, the Davidson Brothers Farm in Texas drove supplemental feed out to their cattle. (Courtesy R. Burns, Texas A&M AgriLife Extension Service)

References

Broxton, P. D., X. Zeng, D. Sulla-Menashe, and P. A. Troch. 2014. A global land cover climatology using MODIS data. Journal of Applied Meteorology and Climatology 53: 1,593–1,605. doi:10.1175/JAMC-D-13-0270.1.

Kelley, W. K., J. D. Scasta, and J. D. Derner. 2016. Advancing knowledge for proactive drought planning and enhancing adaptive management for drought on rangelands: Introduction to a special issue. Rangelands 38(4): 159–161. doi:10.1016/j. rala.2016.06.008.

NASA LP DAAC. 2016. MCD12Q1 Land Cover Type Yearly L3 Global 500 m SIN Grid. NASA EOSDIS Land Processes DAAC, USGS Earth Resources Observation and Science (EROS) Center, Sioux Falls, SD. https://lpdaac.usgs.gov/dataset_discovery/modis/modis_products_table/mcd12q1.

NASA LP DAAC. 2016. MOD11A2.005 MODIS/Terra Land Surface Temperature/Emissivity 8-Day L3 Global 1km SIN Grid V005. NASA EOSDIS Land Processes DAAC, USGS Earth Resources Observation and Science (EROS) Center, Sioux Falls, SD. https://lpdaac.usgs.gov/dataset_discovery/modis/modis_products_table/mod11a2.

O’Neill, P., S. Chan, E. Njoku, and T. Jackson. 2016. SMAP L3 Radiometer Global Daily 36 km EASE-Grid Soil Moisture. Version 3. Boulder, CO, USA: NASA National Snow and Ice Data Center Distributed Active Archive Center. doi:10.5067/7MINGFDCZTES.

Velpuri, N. M., G. B. Senay, and J. T. Morisette. 2016. Evaluating new SMAP soil moisture for drought monitoring in the rangelands of the US high plains. Rangelands 38(4): 183–190. doi:10.1016/j.rala.2016.06.002.

For more information

NASA Land Processes Distributed Active Archive Center (LP DAAC)

NASA National Snow and Ice Data Center DAAC (NSIDC DAAC)

NASA Moderate Resolution Imaging Spectroradiometer (MODIS)

NASA Soil Moisture Active Passive (SMAP)

About the remote sensing data
Satellites Soil Moisture Active Passive (SMAP) Terra and Aqua Terra
Sensors SMAP L-Band Radiometer Moderate Resolution Imaging Spectroradiometer (MODIS) MODIS
Data sets L3 Radiometer Global Daily 36 km EASE-Grid Soil Moisture, Version 3 Land Cover Type Yearly L3 Global 500 m SIN Grid V005 (MCD12Q1)* Land Surface Temperature/Emissivity 8-Day L3 Global 1km SIN Grid V005 (MOD11A2)
Resolution 36 x 36 kilometer 0.5 kilometer 1 kilometer
Parameters Soil moisture Land cover Land surface temperature, land surface emissivity
DAACs NASA National Snow and Ice Data Center Distributed Active Archive Center (NSIDC DAAC) NASA Land Processes DAAC (LP DAAC) NASA LP DAAC
The researchers used the 0.5 kilometer MODIS-based Global Land Cover Climatology product available from the US Geological Survey Land Cover Institute.

Details

Last Updated

Published

Data Center/Project

Land Processes DAAC (LP DAAC)
National Snow and Ice Data Center DAAC (NSIDC DAAC)