Clues in the Nectar

Honeybees signal a worrisome trend in plant-pollinator relationships.

Backyard beekeeper and NASA biological oceanographer Wayne Esaias admired the time series he made of his honeybees’ nectar collection. He had been weighing his beehives daily for more than fifteen years to track how much nectar his bees were collecting from the flowers, tulip poplar trees, and black locust trees in his neighborhood in Maryland. “I plotted the data, out of curiosity,” he said, “And lo and behold, the ebb and flow of my bees’ nectar collection corresponded with climate events, like El Niños and La Niñas.” But as he looked more closely, he saw a curious trend. His bees were gathering nectar earlier in the spring than they did when he began keeping bees in 1992.

Esaias has spent much of his career at NASA's Goddard Space Flight Center studying the patterns and rhythms of microscopic plant growth in the world’s seas and oceans. He knew that on dry land, plants and bees had a delicate and interdependent rhythm of their own. The cycle starts in the spring, when days get warmer and longer. Bees emerge to collect nectar, pollinating flowers and aiding in plant reproduction in the process. As old bees die, queen bees lay as many eggs as they can to build up their colonies for next season. Everything relies on the bees and the flowers coming together when both are ready—when flowers brim with nectar and when hives buzz with enough healthy workers to collect food. When winter comes and days shorten and grow colder, honeybees stay in their hives and plants go dormant until spring arrives, and the cycle starts anew. “But as temperatures get warmer, winters get warmer,” Esaias said. “And when winters are warmer, spring comes earlier. This could cause the synchrony between the plants and pollinators to get out of kilter.”

honeybee
Image Caption

Honeybees are helping remote sensing scientists understand how earlier spring arrival might affect plant-pollinator relationships. (Courtesy P. Stein)

But is that even possible? “It’s possible,” Esaias said. “Plants and pollinators have different thermometers.” Honeybees take their cue from air temperature because their hive boxes rest on the ground. Plants and trees take their cue mostly from soil temperature. “These are two different microclimates,” he said. David Inouye, a professor of biology and an expert on pollination biology and flowering phenology, said that plants and pollinators could differ in their rate of response to an earlier spring, and that this could cause them to get out of sync. Inouye said, “If spring is arriving earlier and air temperatures are warming up sooner, then the bees are likely to be responding. But they may be more sensitive or less sensitive to the temperature change than the plants are, depending on where they are, and what their biology is.”

Disappearing colonies

Honeybees were already in big trouble to begin with. In the early months of 2007, millions of honeybees across the United States suddenly, and quite inexplicably, disappeared. Hundreds of beekeepers found their hive boxes silent. West Coast beekeepers reported losses ranging from 30 to 60 percent. In the East Coast, beekeepers reported that more than 70 percent of their hives had gone empty. News of the disappearing honeybees sent apiarists and scientists scrambling to find an explanation. The disappearing act was given a name: Colony Collapse Disorder (CCD), but no one could directly identify a cause. Farmers became worried, as about a hundred crop species in the United States depend on pollination services by managed honeybee colonies. In a report to the U.S. House of Representatives, an entomologist warned that prior to CCD, honeybee populations were already declining at a fast rate, and could become extinct by 2035 if that trend continues.

honeybee hive
Image Caption

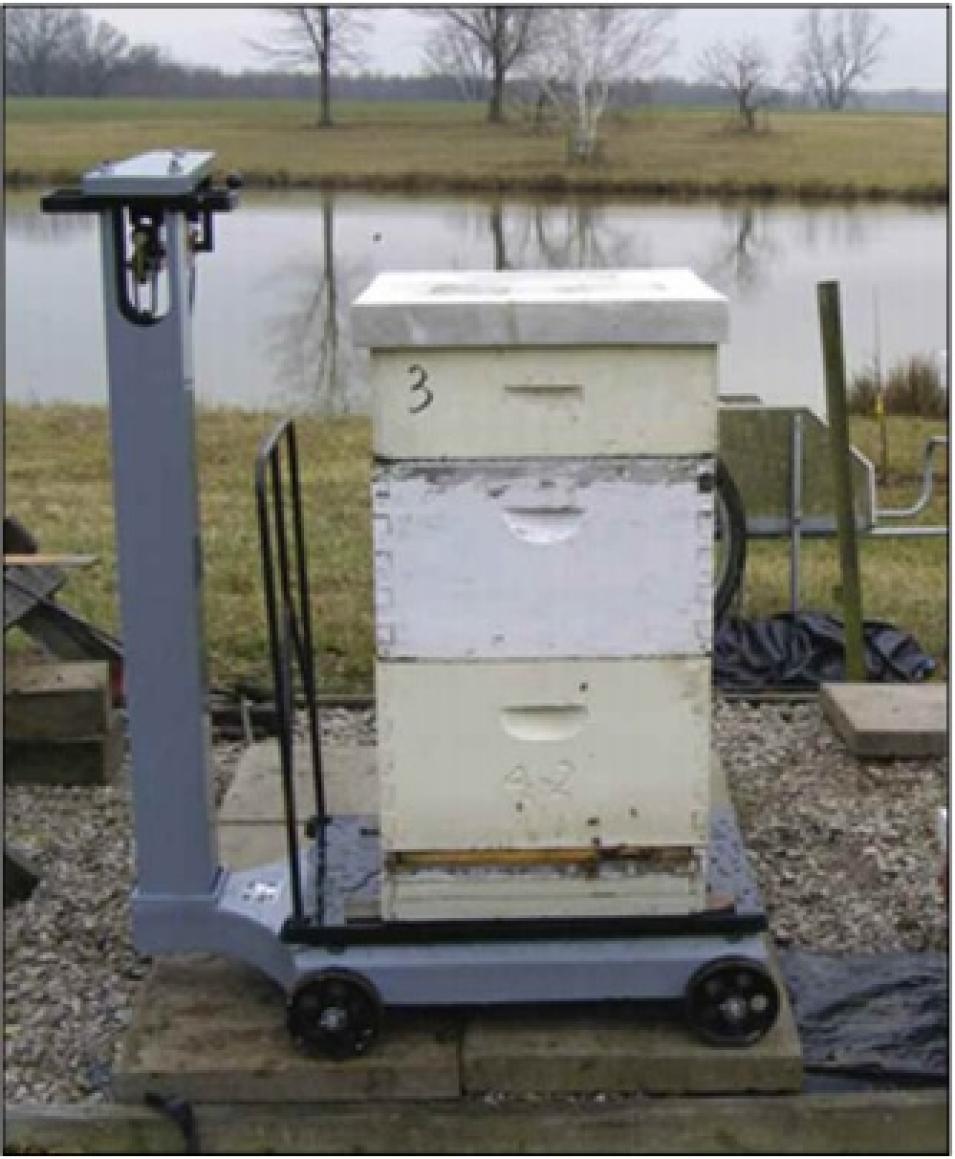
HoneyBeeNet is a network of citizen scientist beekeepers who weigh their honeybee hives daily using huge, industrial-sized weighing scales like this one. A hive can weigh over 500 pounds, and can gain over 20 pounds per day at the peak of the nectar flow. (Courtesy C. Mark)

It was in the midst of this news that Esaias started thinking of bees less as a hobby and more as partners in scientific data gathering. He wondered if honeybees elsewhere in the state were also collecting nectar earlier. Esaias compared data from a beekeeper in Chevy Chase, Maryland, and data from a researcher at the University of Maryland, to his own fifteen-year data set. “There was a very significant trend,” Esaias said. “Spring nectar flow is now twenty-six days earlier than it was in 1970, about a half-day earlier each year on average.”

What the green means

Other scientists were also studying the trend of earlier springs, but from space. Scientists use the Advanced Very High Resolution Radiometer (AVHRR), a satellite sensor that measures Earth reflectance, to study spring green-up, when the Earth turns greener every year during spring. “A study reported that the United States was getting greener earlier as part of climate change,” Esaias said. “The question was, were my bees seeing the same trends as the satellite sensors were seeing? And the answer was yes, they were spot on.”

The AVHRR study found a trend of earlier spring green-ups in the northeast United States and delayed spring green-ups in the southeast United States. Esaias’ data and that of other volunteer backyard beekeepers in the mid-Atlantic region showed earlier nectar collection dates in sync with the earlier spring green-ups mentioned in the study. Historical data from Baton Rouge, Louisiana, and from a volunteer beekeeper in Carencro, Louisiana, were also in sync with the delayed spring green-up that satellites detected in the southeast. “Plants and trees need a certain amount of chilling days to enter dormancy,” Esaias said. “In the southeast United States, plants were not getting enough chilling days, so spring there was delayed.” Esaias thinks that combining data from the honeybees with data from satellites can reveal a lot about how climate change might impact plant-pollinator interactions. “When we have more confirmation that nectar flows from bees follow the vegetation signals we see from satellites, we can better understand how our ecosystems might change,” he said. To do that, he needs data from more beekeepers.

land cover classification
Image Caption

Land cover classification maps such as this one help researchers identify nectar sources and better understand bee colony health. The map on the left shows the different kinds of vegetation that surround Esaias’ honeybee hive in Maryland: a swath of deciduous broadleaf forest (4), surrounded by a mosaic of cropland or natural vegetation (14), and mixed forests (5). The map on the right shows the location of the 6.5 kilometer square subset within a 201-kilometer square area. Red swaths indicate urban areas. (Courtesy NASA Oak Ridge National Laboratory Distributed Active Archive Center)

HoneyBeeNet

Esaias has organized a network of backyard beekeepers, called HoneyBeeNet, now numbering more than eighty volunteers all over the country. Most reside in the mid-Atlantic region where he began his work. But he is rapidly getting more volunteers from different states. “HoneyBeeNet is a network of citizen scientist beekeepers who volunteer to get a scale, measure their beehives’ weights daily, and send us the scale hive data,” he said. Some volunteers start out not quite knowing what to make of the satellite data, but are pleased to see it alongside the data they collected from their beehives. “Others are keen on seeing how their backyard changes from year to year as seen through satellite eyes,” he said. Esaias considers the scale hive data from volunteers as valuable records of the interaction between plants and pollinators, and how effective bees are in collecting nectar. “That’s very hard data to come by,” he said. “Satellite sensors can’t necessarily see the plants blooming. They can only see foliage turning green. That’s why the scale hive data is so valuable in validating what the satellites see,” he said.

Esaias is using the scale hive data to validate vegetation data subsets from the Moderate Resolution Imaging Spectroradiometer (MODIS) sensor on NASA’s Terra and Aqua satellites, available from NASA's Oak Ridge National Laboratory Distributed Active Archive Center (ORNL DAAC). Like the AVHRR sensor, MODIS also measures and maps the density of the Earth’s green vegetation, but at a higher spatial resolution, which means MODIS can provide images over a given pixel of land in finer detail. “The subset data that we get from ORNL is 6.5 by 6.5 kilometers [4 by 4 miles], which means each hive is 3.25 kilometers [2 miles] away from the edge. Bees are sampling that whole area, which makes it nice for comparing with the satellite data. The bees would have already done an integration of the important nectar and vegetation sources as far as they’re concerned. They’ve already done a lot of the work for us,” Esaias said.

The research project, which has evolved from Esaias’ hobby to a NASA-funded study, could help scientists and apiarists understand how plant and pollinator relationships are changing and might change in the future. Data from the volunteers will also be preserved for climate change and land cover change research. “I was a little nervous when I proposed the study to NASA because this was my hobby, you know,” he said. “But there was a real signal in the scale hive data, and I thought it was important. Pollinators are important. It’s crucial for us to understand if our pollination system and plants are going to get messed up or how will they change in response to climate change. I’m not so worried about them getting messed up, but how will they change and what measures can we take as beekeepers and food producers to minimize the impact of any changes that occur.

References

Inouye, D.W. 2008. Effects of climate change on phenology, frost damage, and floral abundance of montane wildflowers. Ecology 89(2): 353-362, doi:10.1890/06-2128.1.

Inouye, D.W. 2007. Impacts of global warming on pollinators. Wings 30(2): 24-27.

Nightingale, J.M., W.E. Esaias, R. E. Wolfe, J.E. Nickeson, and P.L.A. Ma. 2008. Assessing honey bee equilibrium range and forage supply using satellite-derived phenology. In Proceedings of the Geoscience and Remote Sensing Symposium of the IEEE Geoscience and Remote Sensing Society, 3, III-763 - III-766, doi:10.1109/IGARSS.2008.4779460.

U.S. Congress. House Subcommittee on Horticulture and Organic Agriculture, Committee on Agriculture. Colony Collapse Disorder and Pollinator Decline. 110th Cong., 1st sess., March 29, 2007.

vanEngelsdorp, D., J. Hayes Jr., R. M. Underwood, and J. Pettis. 2008. A survey of honey bee colony losses in the U.S., Fall 2007 to Spring 2008. PLoS ONE 3(12): e4071, doi:10.1371/journal.pone.0004071.

Zhang, X., D. Tarpley, and J. T. Sullivan. 2007. Diverse responses of vegetation phenology to a warming climate. Geophysical Research Letters 34, L19405, doi:10.1029/2007GL031447.

For more information

NASA Oak Ridge National Laboratory Distributed Active Archive Center (ORNL DAAC)

Moderate Resolution Imaging Spectroradiometer (MODIS) Land Products Subsets

HoneyBeeNet

About the remote sensing data
Satellites Terra and Aqua
Sensor Moderate Resolution Imaging Spectroradiometer (MODIS)
Data sets MODIS Subsets; Vegetation Indices; Land Cover Dynamics; Land Cover Type
Resolution 250 meter and 500 meter
Parameters Normalized Difference Vegetation Index (NDVI), Enhanced Vegetation Index (EVI), land cover classification, phenology
DAAC NASA Oak Ridge National Laboratory Distributed Active Archive Center (ORNL DAAC)

Standard MODIS land products are available from NASA's Land Processes DAAC (LP DAAC).

Details

Last Updated

Published

Data Center/Project

Land Processes DAAC (LP DAAC)
Oak Ridge National Laboratory DAAC (ORNL DAAC)