Closed Season

In Mexico’s escalating water crisis, a view from the sky provides answers.

When Pascal Castellazzi moved to Toluca in 2012, it was not for the world famous red and green chorizos. Nor was it for the cool climate or the Spanish colonial architecture. The French researcher came to the bustling capital city in search of odd things. He walked around, noting fissures in the ground. Along buckling avenidas, he spied tilting churches and monuments. “Once I saw people enter their sunken house almost by the second floor,” he said. Once, he stood by the banks of the funky-smelling Rio Lerma noting something else that was odd. “The river doesn’t flow much,” he said. “It doesn’t flow at all some parts of the year.”

Castellazzi is a hydrogeologist. To him all these odd notes about Toluca were evidence of a population taking more water from the ground than nature can replenish. And it was not just happening in Toluca. “In a lot of places in Mexico, groundwater depletion leads to land subsidence,” he said. “When you pump too much water out of the ground, pressure decreases in the aquifer below.”

He was referring to the vast layers of water-bearing rock, gravel, or silt underneath Mexico’s landscape, from which groundwater is extracted. Like underground sponges, aquifers compact when too much water is siphoned from them. At the surface, the ground sinks. Whatever is built above an over-exploited and compacted aquifer then tilts, buckles, or fractures.

Castellazzi was keen on studying Mexico’s groundwater supply—more specifically how to measure it. Were the Mexican government’s measurements reliable? If they were, why is the country still in a water shortage so severe that it puts many of its citizens’ lives on hold?

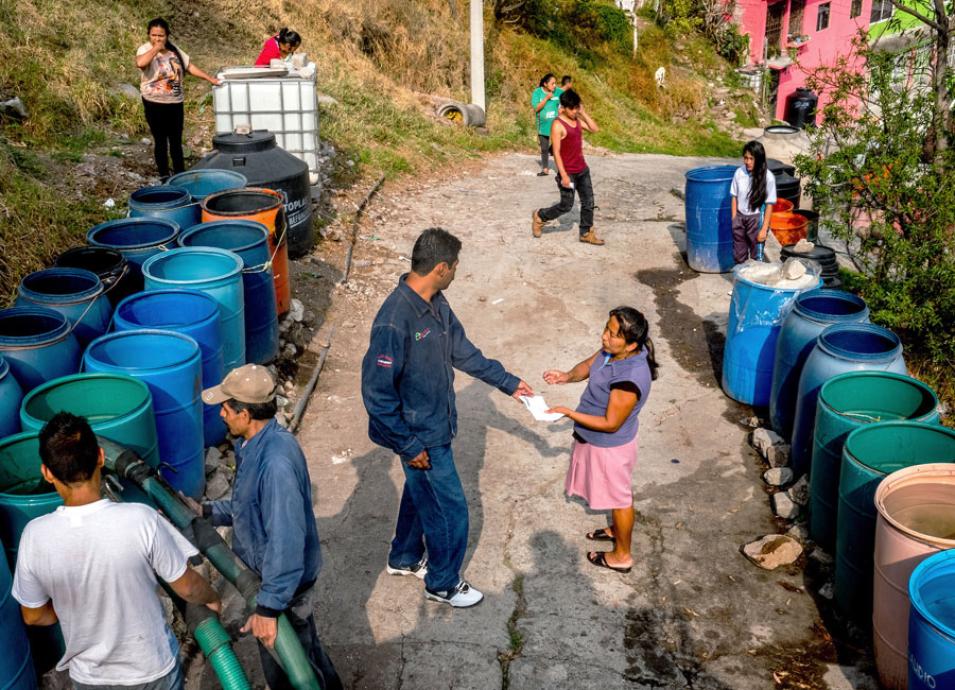
Photograph of people waiting near rows of barrels that will be filled with water
Image Caption

Residents in Ecatapec, a borough of Mexico City, wait for their family’s barrels to be filled. (© L. Forsyth)

Endangered aquifers

The way they describe aquifers in Mexico, you would think they were hunted animals. Many are declared by the government as vedados, which roughly translates to “closed season.” A vedado label means the aquifer is overexploited and must be protected. That does not stop water tankers, or pipas, from pulling up to pumping stations and poaching the water.

Illegal water extraction is probably more the norm than the exception. “Out of Mexico’s 653 aquifers, about 18 percent are vedados,” said Alfonso Rivera, who grew up in Northern Mexico and is now chief hydrologist with the Geological Survey of Canada. It is a troubling statistic, considering these aquifers are supposed to provide 70 percent of the water needs of rapidly expanding industries and the country’s growing population of 120 million.

And Mexico’s residents are feeling it. Sometimes the water flows. More often, it is rationed—days or weeks can go by before residents have access to water. Not all homes in Mexico have multiple faucets. Most people have supply lines coming into their homes, while others have a spigot in their yard, or share a neighborhood spigot. Sometimes the government sends pipas to deliver water from the aquifers. Often, families are forced to purchase water from private pipas and their delivery schedules are seldom reliable. That is why households will either have plastic water tanks called tinacos, or big, blue plastic drums, or smaller jars to store water until the next delivery. In areas too remote for the pipas to reach, residents pay for donkeys to deliver water to their homes. These tedious chores occur weekly, or even daily for the poor. The pursuit of water is nationally viewed as a colossal time suck.

Although Castellazzi saw the day-to-day reality of the water crisis in Toluca and in nearby Mexico City, he was keen on looking at the larger geography for data on aquifer depletion. What if he looked at a major watershed near the cities? The Lerma-Santiago-Pacifico (LSP) seemed ideal. It supplies groundwater to Central Mexico’s busiest cities and industrial areas, namely Mexico City, Guadalajara, Léon, Zapopan, Aguascalientes, Queretaro, Morelia, and Toluca. Data from NASA's Socioeconomic Data and Applications Center (SEDAC) showed these were also among Mexico’s most populated cities. Because the climate in the region is arid to semi-arid, these cities are dependent on groundwater instead of surface water.

Castellazzi checked with Mexico’s National Water Commission, Conagua, and found that the LSP has a deficit of about 2,000 million cubic meters of water per year. That was not surprising. Castellazzi was mostly interested in how they arrived at this number.

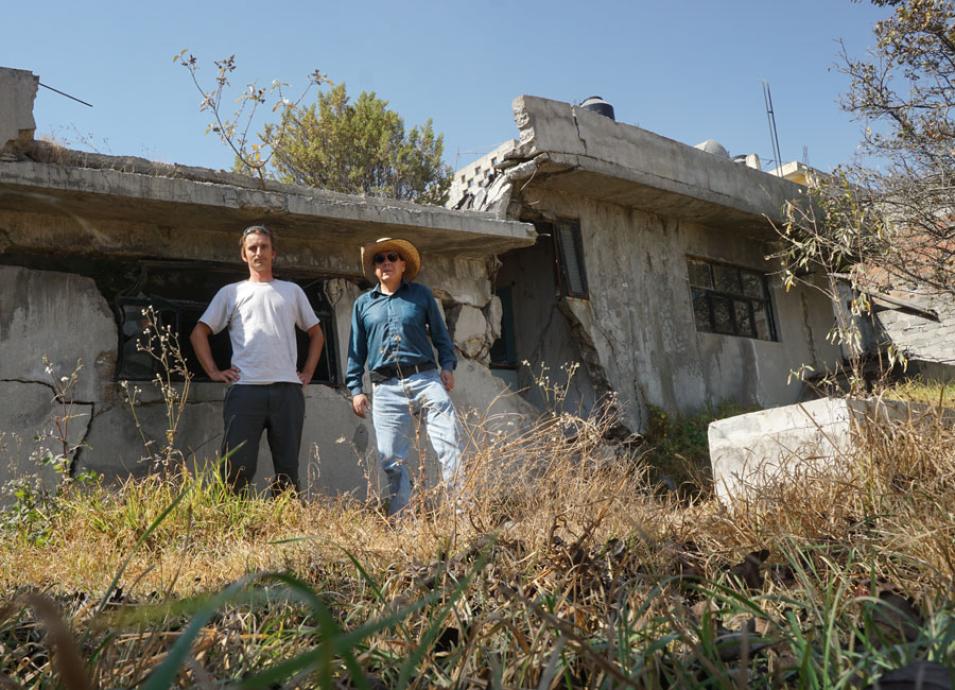
Photograph of two researchers standing in front of a fractured house
Image Caption

Pascal Castellazzi and colleague Jaime Garfias stand in front of an abandoned house in Toluca Valley, Mexico. The house is located along a fracture showing differential movement of up to 5 centimeters (2 inches) per year. (Courtesy P. Castellazzi)

Pushing the limit

“Conagua uses the water budget method to determine if an aquifer is depleted or not,” Castellazzi said. To calculate changes in groundwater supply, Conagua adds the discharge rate to the net extraction rate, and then subtracts the sum from the recharge rate. If the result is a negative value, that means the water budget is in deficit.

But Rivera, a co-author on Castellazzi’s study, said that approach had many drawbacks. “They estimate parameters,” Rivera said. “They don’t measure them.”

For example, the net extraction rate is only estimated. “They don’t go out and measure how much water is actually being pumped out of the aquifer,” Rivera said. In addition, the government may not have enough data from ground instruments to make their estimates reliable.

Castellazzi thought it was a perfect opportunity to test how data from satellites orbiting Earth could measure water in aquifers. The Gravity Recovery and Climate Experiment (GRACE) satellites synchronously orbit Earth more than a hundred miles apart. They sense variations in Earth’s gravity field caused by changes in ice sheets, global sea level, and groundwater storage.

It was a great tool for Castellazzi’s project, but it also had a limitation. GRACE is ideal for measuring large expanses, like continents, whole oceans, and large countries—ideally anything bigger than 200,000 square kilometers (77,220 square miles). “The LSP watershed is 133,000 square kilometers [51,000 square miles],” he said. “So we were definitely pushing it.”

When Castellazzi extracted the LSP’s water volume from GRACE data, he only found a deficit of about 158 to 210 million cubic meters of water a year, not 2,000 million. Rivera said, “That was a big difference.”

Castellazzi added, “After playing with many versions of GRACE data, I could not find the deficit that we were expecting. We started to wonder why, and that’s how I thought back to all the field work we had done.”

Remembering all the signs of subsidence in Toluca, Castellazzi thought of another satellite sensor. The Phased Array type L-Band Synthetic Aperture Radar (PALSAR) that flew on the Advanced Land Observing Satellite (ALOS) and can be used to measure ground deformation. Castellazzi used an ALOS PALSAR subsidence map to assess the error related to GRACE’s low resolution, and found it could only dampen the signal by a factor of 2.7, which is still insufficient to explain the difference with data from Conagua.

That still left a 1,200 million cubic meter difference between the Conagua estimates and the satellite measurements. Where was this missing water? Were the Conagua estimates way off? Or was it the satellite measurements?

Stumped, Castellazzi once again reviewed his field notes. “I find that it is really important to link geodetic observations to field observations,” he said. “Trying to explain something with satellite data has to make sense with what we see in the field.” The missing water reminded him of his walks along the Rio Lerma.

Castellazzi knew that many farms and industries upstream use a lot of groundwater daily, and that some of it was discharged into the Rio Lerma as wastewater or into farmland as irrigation water. Theoretically, some of that water should eventually find its way to the Rio Lerma, and yet why was the riverbed often dry downstream in Toluca? “All this extracted water, where does it go?” he said.
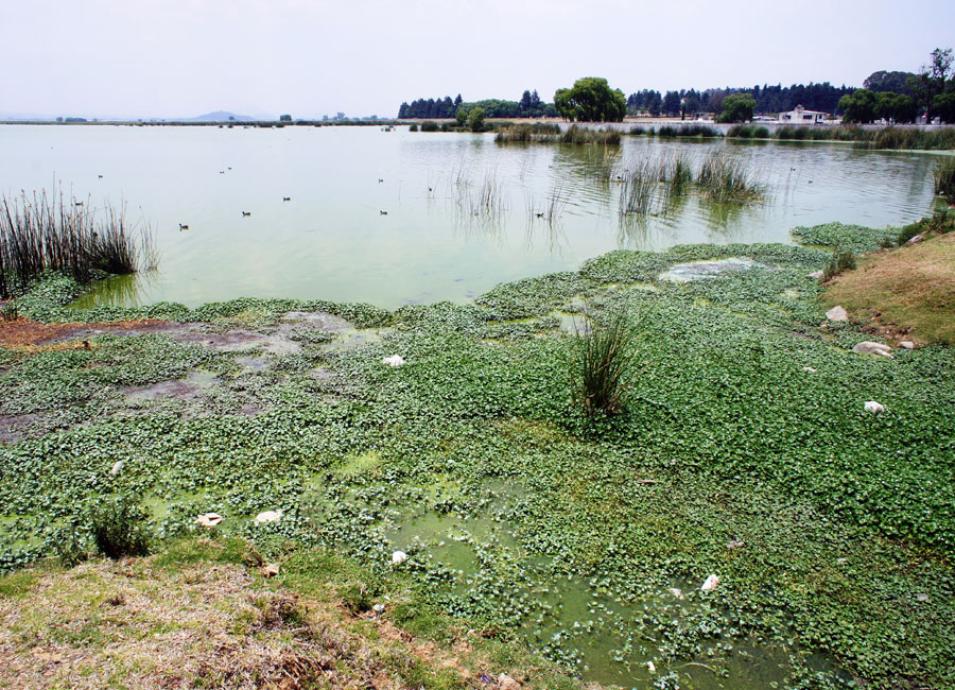
Photograph of algae clogging a lagoon full of wastewater
Image Caption

Algae clogs a lagoon in Toluca Valley, Mexico. Factories and homes that deplete the valley’s aquifers dump their wastewater here. (Courtesy P. Castellazzi)

Unrecoverable

Castellazzi analyzed the ALOS PALSAR subsidence map again, this time comparing it with a land use map. He used both data sets to estimate how much water deficit each land use class tended to inflict on the aquifers each year. “Our results suggest that at least a third of the groundwater depletion is caused by groundwater pumping for industries and municipalities,” Castellazzi said. However, water from municipal pipes drip back into aquifers through leaky conduits. Factories discharge wastewater into canals and streams, and farms return some extracted water back into the ground through irrigation. According to Castellazzi, this “returned water” could be the missing water that GRACE could not detect.

“We trust the GRACE signal is relatively a good signal and that it is telling us what is happening,” Rivera said. “However, everything is integrated into that signal. GRACE can see a groundwater source and it sees a trend, but it doesn’t see why the trend is changing.”

Castellazzi’s findings also suggest that the water budget method that Conagua uses underestimates the amount that returns to the aquifers as wastewater and irrigation water. This supports the idea that the 2,000 million cubic meters of groundwater deficit in the LSP region should probably be lower. Castellazzi said it also suggests problems with groundwater quality in the future.

While there is still more work to be done, Castellazzi thinks combining GRACE and ALOS PALSAR observations holds promise for mapping groundwater depletion in Mexico’s endangered aquifers. Laurent Longuevergne, a researcher who specializes in developing geodetic tools in the study of hydrogeology, agrees. “The most valuable point of Castellazzi’s study is the potential to use GRACE in complex, small aquifer systems by joint interpretation with remotely-sensed interferometric synthetic aperture radar or InSAR,” he said.

“Water is a very political thing here,” Castellazzi said. “Our study offers the ability to assess the evolution of groundwater and water stocks in an apolitical way and to base governance on that.”

Recently, researchers and academics in Mexico proposed changes in the country’s water law. “They want the government to make decisions on the vedados based on science, and not on speculations or calculations that are not useful,” Rivera said. “When I read about this, I was very happy, because some of the work that we have done goes that direction. I truly believe that this methodology that uses remote sensing like GRACE and InSAR can be very useful in supporting this new law.”

Castellazzi feels there is no time to waste when it comes to la veda. “A large part of the compaction from over-depleted aquifers is unrecoverable,” he said. “Even if groundwater levels come back, an aquifer’s ability to store water could be decreased forever. And that, unfortunately, is something we are leaving our future generations to deal with.”

Data images showing various aquifer storage trends around the Lerma-Santiago-Pacifico watershed
Image Caption

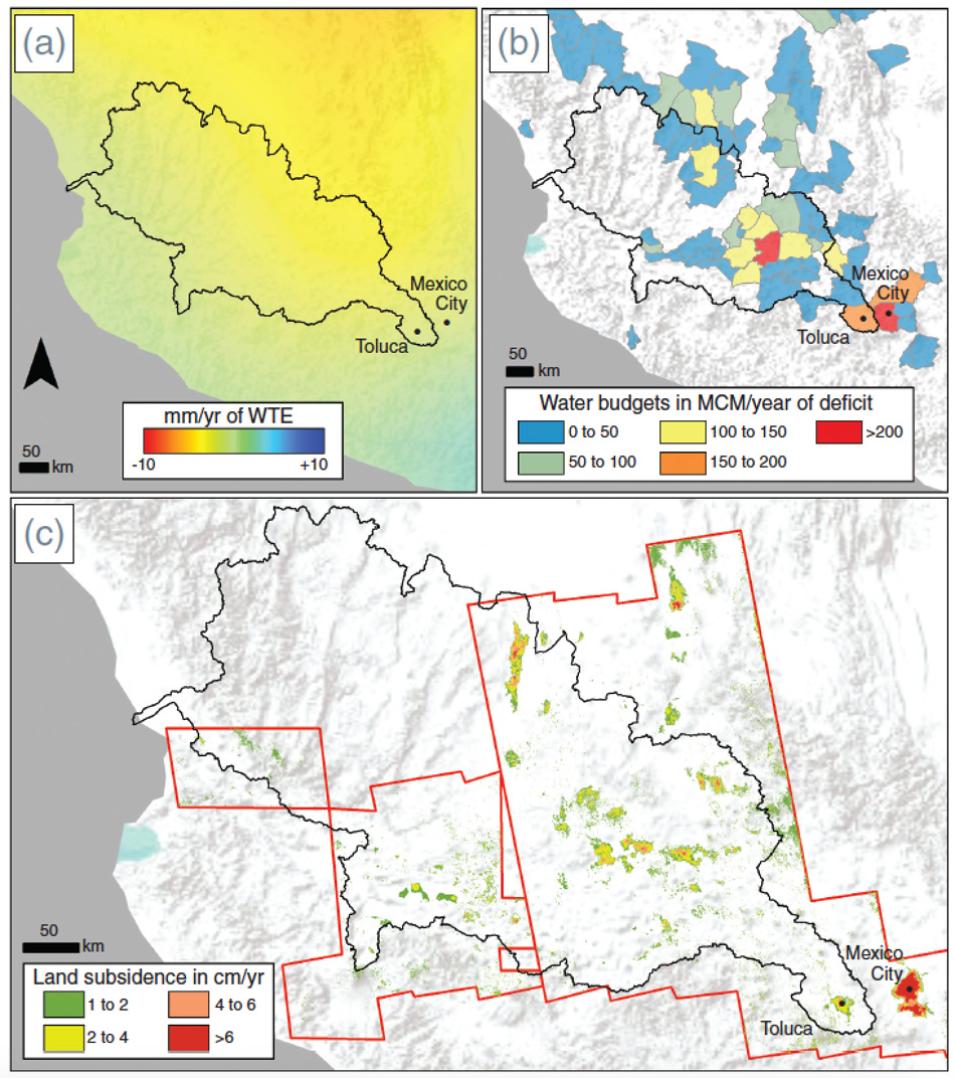
Map (a) shows Gravity Recovery and Climate Experiment (GRACE)-derived groundwater storage trends, in millimeters per year of water thickness equivalent (WTE). Warmer colors indicate groundwater deficit, while cooler colors indicate groundwater surplus. The black outline marks the Lerma-Santiago-Pacifico watershed. Map (b) shows depleted aquifers as observed by the Mexican government’s groundwater budget method, in million cubic meters per year. Map (c) shows areas subsiding because of groundwater overexploitation, in centimeters per year. Land subsidence data are derived from Advanced Land Observing Satellite Phased Array type L-Band Synthetic Aperture Radar (ALOS PALSAR) data, using InSAR techniques. (Courtesy P. Castellazzi, et al., 2016, Water Resources Research)

References

Bettadpur, S. 2012. UTCSR Level-2 Processing Standards Document, GRACE 327-742, CSR-GR12-xx, Univ. of Tex. Cent. Space Res. ftp://podaac.jpl.nasa.gov/allData/grace/docs/L2-CSR0005_ProcStd_v4.0.pdf.

Castellazzi, P., R. Martel, A. Rivera, J. Huang, G. Pavlic, A. I. Calderhead, E. Chaussard, J. Garfias, and J. Salas. 2016. Groundwater depletion in Central Mexico: Use of GRACE and InSAR to support water resources management. Water Resources Research 52: 5,985–6,003. doi:10.1002/2015WR018211.

Center for International Earth Science Information Network - CIESIN - Columbia University, and Centro Internacional de Agricultura Tropical - CIAT (2005), Gridded Population of the World, Version 3 (GPWv3): Population Density Grid, NASA Socioeconomic Data and Applications Center (SEDAC), New York. doi:10.7927/H4XK8CG2.

NASA Alaska Satellite Facility Synthetic Aperture Radar Distributed Active Archive Center (ASF SAR DAAC). 2012. ALOS PALSAR data. Copyrighted by JAXA, METI. Fairbanks, AK, USA: NASA ASF DAAC. https://www.asf.alaska.edu/sar-data/palsar/about-palsar.

Rodell, M. and H. K. Beaudoing, NASA/GSFC/HSL. 2016. GLDAS Noah Land Surface Model L4 monthly 0.25 x 0.25 degree V2.1. Greenbelt, MD, USA: Goddard Space Flight Center Earth Sciences Data and Information Services Center (GES DISC). doi:10.5067/SXAVCZFAQLNO.

Rodell, M., et al. 2004. The global land data assimilation system. Bulletin of the American Meteorological Society 85(3): 381–394. doi:10.1175/BAMS-85-3-381.

For more information

NASA Alaska Satellite Facility Distributed Active Archive Center (ASF DAAC)

NASA Goddard Earth Sciences Data and Information Services Center (GES DISC)

NASA Physical Oceanography DAAC (PO.DAAC)

NASA Socioeconomic Data and Applications Center (SEDAC)

Japan Aerospace Exploration Agency Advanced Land Observing Satellite (ALOS-1)

NASA Gravity Recovery and Climate Experiment (GRACE)

Phased Array type L-Band Synthetic Aperture Radar (PALSAR)

About the remote sensing data
Satellites Japan Aerospace Exploration Agency (JAXA) Advanced Land Observing Satellite (ALOS) Gravity Recovery and Climate Experiment (GRACE)
Sensors Phased Array type L-Band Synthetic Aperture Radar (PALSAR) K-Band Ranging System
Data sets ALOS PALSAR L1.1 GRACE Static Field Geopotential Degree 96 coefficients CSR Release 5.0
Resolution 10 meter azimuth 1 x 1 or 0.25 0.25-degree sampling grids - actual sensor resolution is around 400 x 400 kilometer
Parameters Terrain Gravity
DAACs NASA Alaska Satellite Facility Distributed Active Archive Center (ASF DAAC) NASA Physical Oceanography DAAC (PO.DAAC)
About the data
Data sets Global Land Data Assimilation Systems-1 (GLDAS-1): CLM10, MOS10, NOAH10, NOAH015, and VIC10 Gridded Population of the World (GPW), v3
Resolution Various 2.5 arc-minute ¼ degree, ½ degree, 1 degree
Parameters Land surface models Population density
DAACs NASA Goddard Earth Sciences Data and Information Services Center (GES DISC) NASA Socioeconomic Data and Applications Center (SEDAC)

Details

Last Updated

Published

Data Center/Project

Alaska Satellite Facility DAAC (ASF DAAC)
Goddard Earth Sciences Data and Information Services Center (GES DISC)
Physical Oceanography DAAC (PO.DAAC)
Socioeconomic Data and Applications Center (SEDAC)