Dr. Philip Thompson

The global average sea level is rising. Dr. Philip Thompson uses NASA Earth science data to explore how—and when—this will affect vulnerable communities.

Dr. Philip Thompson, Assistant Professor, Department of Oceanography, School of Ocean and Earth Science and Technology, University of Hawai‘i at Mānoa; Director, University of Hawai‘i Sea Level Center, Honolulu, HI

Research interests: Studying the drivers and impacts of sea level variability along with the impact of future sea level rise on the frequency of high-tide flooding events and water level extremes.

Research highlights: According to the World Meteorological Organization, this past July was likely the warmest month ever recorded on Earth since official record-keeping began more than 100 years ago. This historic heat has consequences. As noted in a recent Washington Post article, data from the Danish Meteorological Institute indicate that during July the melting Greenland ice sheet added 197 billion tons of water into the Atlantic Ocean. The article quotes a researcher at the Institute observing that “this is enough to raise sea levels by 0.5 millimeters, or 0.02 inches, in a one-month time frame.”

The melting did not just begin, however. Data collected by coastal tide gauges and instruments aboard Earth observing satellites, and available through NASA’s Sea Level Change website, show that the global average sea level rose almost seven inches (178 mm) over the past century alone. Looking back to the late 19th century, the data are clear: Earth’s average sea level is rising, and the rate of rise has increased since the mid-20th century.

Two graphs showing the rise in average global sea level over almost 140 years. Left graph is created from tide gauge data and starts in 1880; right graph is sea height data created from satellite altimetry missions. Both graphs show an upward trend, with a steeper slope as they approach current year data.
Image Caption

Left graph is sea level change measured by coastal tide gauges between 1880 and 2013. Credit: Commonwealth Scientific and Industrial Research Organisation (CSIRO). Right graph is sea height variation as measured by altimeters aboard Earth observing satellites from 1993 to present. Red dot at upper right tip of graph indicates data as of April 27, 2019. Credit: NASA’s Goddard Space Flight Center/NASA’s Physical Oceanography Distributed Active Archive Center (PO.DAAC). Both graphs available at NASA’s Sea Level Change website.

Identifying the many drivers of sea level change—including the reasons why some regions are seeing sea level rise while other regions are seeing sea levels fall—is one focus of Dr. Philip Thompson’s research. As director of the University of Hawai‘i Sea Level Center, Thompson oversees a global network of more than 80 tide gauges and curates internationally-sourced tide gauge sea level datasets. He also develops products to help inform decision-makers in vulnerable communities about the impacts of sea level change, impacts that are expected to increase in severity as average global temperatures continue to rise.

First, a little background. Global average sea levels are influenced by two primary factors, both of which relate to increasing average global temperatures. One factor is water added to oceans from melting ice sheets and glaciers, particularly from areas near the poles. A second factor is the expansion of seawater as it warms. Since greenhouse gasses trap heat in Earth’s atmosphere and oceans absorb more than 90 percent of this heat, thermal expansion is a significant contributor to global sea level rise.

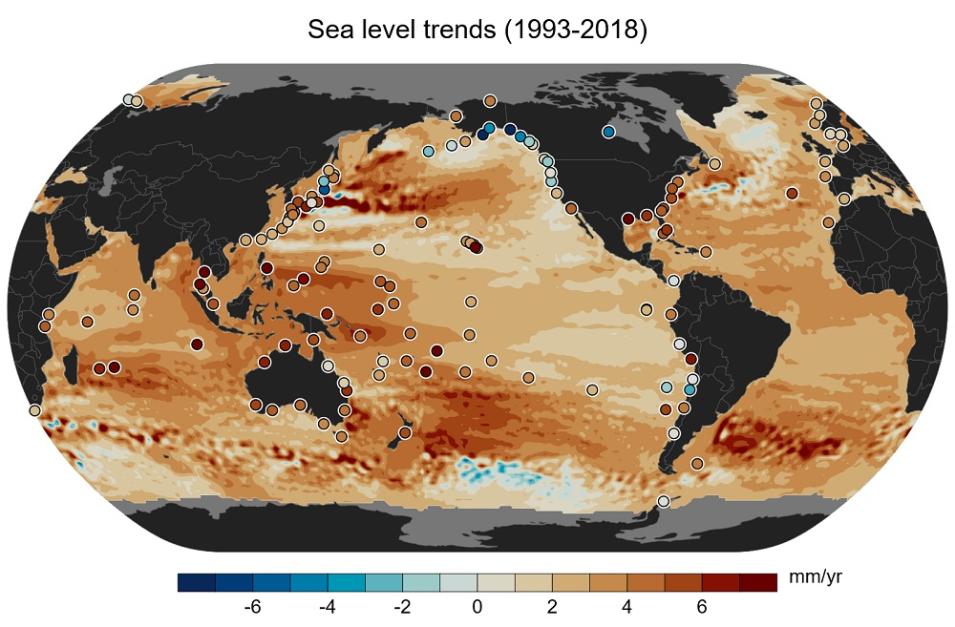
Along with global sea level changes, sea levels also fluctuate regionally. These regional sea level variations are more complex, and involve factors including wind blowing over the ocean leading to uneven warming of the ocean surface and the uneven transport of ocean heat, changes in gravity and Earth’s rotation caused by the loss of huge quantities of ice from continents (more about this below), uplift from earthquakes, and localized precipitation. The result is that even while the global average sea level is rising, some regions are experiencing falling sea levels while others are seeing sea levels rise faster than average. To better understand the drivers behind these changes, Thompson relies on data from tide gauges and satellite-borne instruments, both of which complement each other.

Combined image showing sea level trends as measured by tide gauges and satellite-borne altimeters. Image graphically shows the difference between average global sea level measured by satellites (which is rising) and regional sea level measured by tide gauges (which is rising in most locations, but falling in others).
Image Caption

Differences between global sea height change detected by satellite altimeters and regional sea level change measured by tide gauges is easily seen in this University of Hawai‘i Sea Level Center (UHSLC) map showing overall sea level trends from the start of satellite-collected ocean height measurements in 1993. Colored contours indicate sea level trends derived from joint NASA/CNES satellite altimetry missions. Colored circles are sea level trends from fixed tide gauges. Trends were calculated using tide gauge data from the UHSLC Fast-Delivery database and Ssalto/Duacs altimeter products produced and distributed by the European Union Copernicus Marine and Environment Monitoring Service (CMEMS). Image reproduced courtesy of UHSLC.

The orbiting satellites providing the sea height data used by Thompson sample about 95 percent of the ice-free global ocean. However, they have a 10-day repeat cycle and might miss short-duration, high-impact changes in water level caused by events like tsunamis and storm surges. Fixed tide gauges, on the other hand, do not have the spatial coverage of a satellite instrument, but are better able to capture short-duration changes in sea level caused by localized high-impact events. As a result, both tide gauges and remotely-sensed satellite data are essential for comprehensive studies of the drivers and impacts of sea level change, with tide gauges also being vital for validating satellite-collected data.

The satellite data used by Thompson come from several ocean surface topography missions designed to measure ocean height using altimeters. These altimetry missions include the joint NASA/French Space Agency Ocean Surface Topography Experiment (TOPEX)/Poseidon, Jason-1, and Ocean Surface Topography Mission (OSTM)/Jason-2. Data from these missions are available through NASA’s Physical Oceanography Distributed Active Archive Center (PO.DAAC), which archives and distributes data in NASA’s EOSDIS collection related to the physical processes and conditions of the global oceans.

As noted above, changes in sea level are associated with variations in Earth’s gravity field. As ice sheets melt, a tremendous amount of ice mass packed into small continental areas gets redistributed in liquid form evenly around the global ocean (such as the melting in Greenland this past July that converted billions of tons of ice sheet mass into liquid water that flowed into the Atlantic Ocean). The changes in gravity associated with ice melt can be tracked using data from the joint NASA/German Space Agency (DLR) Gravity Recovery and Climate Experiment (GRACE, operational 2002 to 2017) and GRACE Follow-On (GRACE-FO, launched in 2018) missions, which precisely map Earth’s gravity field (Thompson currently uses GRACE data in his research, but not data from GRACE-FO).

The movement of water mass from continents to ocean not only alters the gravitational field of Earth, it also produces specific patterns of sea level change that are unique to each melt source. Given the unique nature of these sea level change patters, they have been called “ice melt fingerprints.” Research by Thompson and his colleagues explored the impact of these ice melt fingerprints on historical sea level trends measured by tide gauges and found that the fingerprints can have a substantial effect on estimates of sea level rise over the last century.

Two images of the U.S. Gulf Coast/Florida showing areas that could be inundated from partial melting of the Greenland ice sheet. Left image shows the effect of a one-meter rise in sea level, with areas around New Orleans and the extreme southern Florida coast being inundated. Right image shows the effect of a six-meter rise in sea level, with all of southern Louisiana (including New Orleans) and all of southern Florida (including Miami) inundated.
Image Caption

Even a partial melting of the Greenland ice sheet could raise sea level one-meter (approximately three-feet). If it melted completely, the Greenland ice sheet contains enough water to raise global sea level by five-to-seven meters (16 to 23 feet). Left image is the potential effect of a one-meter rise in sea level on Florida, the Northern Caribbean, and the U.S. Gulf Coast. Right image is the potential effect of six-meters of sea level rise. Red indicates land that would be covered by water. Images available through NASA’s Global Climate Change website and created by the Center for Remote Sensing of Ice Sheets (CReSIS).

As the world continues to warm, the impacts of sea level rise are shifting from questions of “if” this rise will impact coastal regions to “how much” of an impact this will have. According to a 2018 report by the Intergovernmental Panel on Climate Change (IPCC), the average global temperature is likely to rise 1.5°C between 2030 and 2052 if it continues to increase at the current rate (some regions already have reached or passed this critical threshold). Looking at the impacts of this on global sea level, the IPCC concludes that “Increasing warming amplifies the exposure of small islands, low-lying coastal areas and deltas to the risks associated with sea level rise for many human and ecological systems, including increased saltwater intrusion, flooding and damage to infrastructure (high confidence).”

Thompson is involved with numerous research efforts to better understand and help prepare for these expected impacts. As a member of NASA’s Sea Level Change Science Team, he is leading a study to quantify the impact of future sea level rise on the frequency of high-tide flooding along U.S. coastlines, including U.S. island territories. The results of this work will be incorporated into a dynamic, web-based tool hosted on NASA’s Sea Level Change portal designed to support decision-makers.

Closer to home, he and his students recently examined the factors that led to an unprecedented number of high-tide flooding events around Hawai‘i during the summer of 2017. Using satellite altimetry data, one of his graduate students documented how ocean eddies and the 2015 to 2016 El Niño event elevated sea levels to record heights and contributed to local flooding of roads and repeated over-wash of Waikiki beach in Oahu. These events led to further research into how the frequency of high tide flooding will evolve in Honolulu in coming decades and identified the potential for a four-fold increase in the number of flooding events in the 2030s to the 2040s.

Meanwhile, historic ice loss continues on the Greenland ice sheet. New data indicate that the ice sheet lost 12.5 billion tons of ice on August 1—the largest single-day ice loss by volume from the ice sheet ever recorded. The bottom line is that global average sea levels are rising, and more and more communities, regions, and nations will be impacted by this process. Thanks to the work and research of Thompson, his colleagues, and his students—aided by data collected by instruments aboard Earth observing satellites—the world will be better prepared to respond.

Representative data products used:

  • Available through NASA’s PO.DAAC:
    • NASA Making Earth Science Data Records for Use in Research Environments (MEaSUREs) Gridded Sea Surface Height Anomalies Version 1812 (doi:10.5067/SLREF-CDRV2)
    • Global Mean Sea Level Trend from Integrated Multi-Mission Ocean Altimeters TOPEX/Poseidon, Jason-1, and OSTM/Jason-2 Version 4.2 (doi:10.5067/GMSLM-TJ142)
    • JPL GRACE Mascon Ocean, Ice, and Hydrology Equivalent Water Height JPL Release 06 Version 1 (doi:10.5067/TEMSC-3MJ06)
  • Available through the National Oceanic and Atmospheric Administration’s (NOAA) National Centers for Environmental Information:
    • Sea level measured by tide gauges from global oceans as part of the Joint Archive for Sea Level (JASL) since 1846 (doi:10.7289/V5V40S7W)

Read about the research:

Thompson, P.R., Widlansky, M.J., Merrifield, M.A., Becker, J.M. & Marra, J.J. (2019). A Statistical Model for Frequency of Coastal Flooding in Honolulu, Hawai‘i, During the 21st Century. Journal of Geophysical Research: Oceans, 124(4): 2787–2802 (doi:10.1029/2018JC014741).

Yoon, H., Widlansky, M.J. & Thompson, P.R. (2018). “Nu‘a Kai: Flooding in Hawai‘i caused by a “stack” of oceanographic processes” [in “State of the Climate in 2017”]. Bulletin of the American Meteorological Society, 99(8): S88-S89. doi:10.1175/2018BAMSStateoftheClimate.1

Thompson, P.R., Hamlington, B.D., Landerer, F.W. & Adhikari, S. (2016). Are long tide gauge records in the wrong place to measure global mean sea level rise? Geophysical Research Letters, 43(19): 10403-10411. doi:10.1002/2016GL070552

Thompson, P.R., Piecuch, C.G., Merrifield, M.A., McCreary, J.P. & Firing, E. (2016). Forcing of recent decadal variability in the Equatorial and North Indian Ocean. Journal of Geophysical Research: Oceans, 121(9): 6762-6778. doi:10.1002/2016JC012132

For more information

Explore more Data User Profiles

Details

Last Updated

Data Center/Project

Physical Oceanography DAAC (PO.DAAC)