Dr. Owen Cooper

Data from NASA’s Atmospheric Science Data Center help Dr. Owen Cooper monitor and track tropospheric ozone.

Dr. Owen Cooper, Senior Research Scientist, Cooperative Institute for Research in Environmental Sciences, University of Colorado Boulder/NOAA Chemical Sciences Laboratory

Research Interests: The regional and intercontinental transport of atmospheric trace gases and particulate matter; trends in U.S. and global air quality; the global tropospheric ozone budget; and the stratosphere-troposphere exchange processes.

Research Highlights: Of all the chemical compounds found in Earth’s atmosphere, ozone (O3) is something of a two-edged sword. In the stratosphere (the layer of the atmosphere 10 to 40 kilometers above the surface) ozone acts as a shield to protect life on Earth, including humanity, from the Sun’s harmful ultraviolet radiation. A weakening of this shield would make humans more susceptible to skin cancer, cataracts, and impaired immune systems. However, in the troposphere (the layer of the atmosphere from the surface up to about 12 kilometers) ozone is a harmful pollutant that can damage lung tissues when inhaled and harm the cell membranes of plants. Further, when it resides at the top of the troposphere, ozone can act as a greenhouse gas by trapping heat in the atmosphere, thereby contributing to global warming.

The natural concentration of ozone at the surface is about 10–20 parts per billion (i.e., 10 molecules of ozone for every billion molecules of air). However, the levels of tropospheric ozone can rise when pollutants such as nitrogen oxide (NOx) gases from vehicle and industrial emissions react in the presence of sunlight. Given ozone’s potential to be a harmful pollutant and greenhouse gas, atmospheric scientists around the globe are keen to monitor its levels in the troposphere.

“It’s generally gone up over the past 150 years or so,” said Dr. Owen Cooper, Senior Research Scientist with the Cooperative Institute for Research in Environmental Sciences (CIRES) at the University of Colorado Boulder and the NOAA Chemical Sciences Laboratory. “Down near the surface, on the local and regional scale, we also want to know if air quality is improving or getting worse. In places like the Eastern United States, due to effective emissions controls, ozone has really come down. But in the developing world and in places like China and India, it’s getting worse as their emissions go up.”

Cooper would know. Since 2014, he’s led the Tropospheric Ozone Assessment Report (TOAR), an international effort initiated by the International Global Atmospheric Chemistry (IGAC) Project to provide the global atmospheric research community with up-to-date scientific assessments of the trends and global distribution of tropospheric ozone from the surface to the tropopause, the atmospheric boundary separating the troposphere from the stratosphere.

“TOAR is an international effort to understand how much ozone is in the troposphere and whether or not it’s increasing or decreasing,” said Cooper. “It’s complicated because ozone is very reactive. It’s not like carbon dioxide, which more or less does the same thing everywhere. Ozone has a short lifetime and is difficult to track. So, it takes efforts from dozens, even hundreds of scientists from around the world to do that.”

The first phase of TOAR ended in 2019, so Cooper and his colleagues are now in the second phase, which will conclude in 2024. At that time, the research team will provide updates on the tropospheric ozone concentrations around the globe, just as it did at the conclusion of phase 1. (Note: TOAR’s reports can be found on the initiative’s website linked above.)
Miles above the surface of the Earth, a thin layer of ozone gas acts as a shield that protects us from harmful ultraviolet light. Credit: NASA
Image Caption

Miles above the surface of Earth, a thin layer of ozone acts as a shield that protects us from harmful ultraviolet light. Credit: NASA.

“Ozone never stops. It’s always changing. So, the plan is to give updates on ozone every 5 or 6 years,” said Cooper. “In the United States, ozone at the surface is plummeting. The air is cleaning up because of emissions controls; as our automobile fleet continues to transition to electric, we expect ozone to continue to decrease.”

Cooper and his colleagues expect to see the same decreases in Europe, but not in South and East Asia.

“Right now, the ozone in [South and East Asia] keeps going up. At some point, especially if they transition rapidly to renewable energy, we should see ozone come down in those regions, so we’re keeping an eye on that,” he said.

To do that, Cooper and his fellow researchers use a variety of airborne, in situ, and satellite data from NASA’s Atmospheric Science Data Center (ASDC) and other sources. Located at NASA'S Langley Research Center in Hampton, Virginia, the ASDC manages, archives, and distributes NASA Earth science data related to radiation budget, clouds, aerosols, and tropospheric composition, and provides tools and applications for working with these data. These data are important for understanding the causes and processes of global climate change and the consequences of human activities on Earth’s atmosphere and climate.

“We use ozone observations from [the ASDC] archive of research aircraft missions going back to the 1990s (e.g., the Pacific Exploratory Mission (PEM) West, PEM Tropics, TRACE-P, and so on) that looked at air pollution in remote regions of the world,” said Cooper. “We’ve used those data to sort of build up a 30-year record of ozone changes based on actual observations.”

Cooper and his colleagues then combine these data with other datasets, including airborne data from the Alpha Jet Atmospheric Experiment (AJAX) based at NASA’s Ames Research Center (AMES), which provides data that are crucial for assessing the amount of ozone flowing into California from across the Pacific Ocean; ground-based data from the Tropospheric Ozone Lidar instrument at NASA's Jet Propulsion Laboratory’s (JPL) Table Mountain Facility (TMF) near Los Angeles, which measures ozone in both the troposphere and the stratosphere; data collected by ozonesondes carried by weather balloons launched by NASA, NOAA, and Environment Canada; and space-based observations, such as measurements of ozone’s global distribution acquired by the Ozone Monitoring Instrument (OMI) aboard NASA’s Aura satellite.

“Basically, what we’ve been doing for the past 10 years is compiling all the ozone observations we can get our hands on across Western North America to try and understand how much ozone is flowing in from across the Pacific Ocean,” Cooper said. “In particular, we want to know how much impact Asia is having on the ozone levels in Western North America.”

Recently, Cooper and his TOAR colleagues have been sharing their research findings in a series of papers, the first of which appeared in the journal Elementa in 2018. In that publication, lead author Dr. Audrey Gaudel of CIRES and NOAA’s Earth Systems Laboratory along with Cooper and others provided evidence that “ozone in the 21st century is greater than during the 1970s and 1980s.” At the same time, the researchers also noted that, while some remote sites and many sites in the heavily polluted regions of East Asia show ozone increases since 2000, others showed decreases and there was no discernible pattern for changes in surface ozone concentrations since 2000.

A photo of the atmospheric scientists who took part in the first TOAR workshop held in Madrid, Spain, in April 2015.
Image Caption

A photo of the atmospheric scientists who took part in the first TOAR workshop held in Madrid, Spain, in April 2015. Image courtesy of Dr. Cooper.

“The [paper] published in 2018 was from the TOAR report [and it] basically summarized everything we know about the present-day global distribution and trends of ozone with a focus on its impact on climate change,” Cooper said. “We were able to show with many years of satellite data that ozone had increased since the 1970s, but at the time, we weren’t really sure if ozone was continuing to increase. We didn’t have enough data.”

Cooper and his TOAR colleagues eventually obtained the data they needed from the In-Service Aircraft for a Global Observing System (IAGOS) database, which contains ozone observations from more than 60,000 commercial aircraft flights worldwide. Using these data, they were able to analyze ozone trends above 11 regions—Germany, the Gulf of Guinea, India, Indonesia, Malaysia, Northeast China/Korea, the Northeastern United States, the Persian Gulf, South America, Southeast Asia, and Western North America—from 1994 to 2016.

From this dataset, and through comparisons with observations from OMI and the Microwave Limb Sounder (MLS), another instrument aboard the Aura satellite, Cooper and his fellow researchers were able to show that ozone had increased throughout the Northern Hemisphere from 1994 through 2016.

“During the past 22 years, median ozone values have increased in the free troposphere above all 11 study regions,” the researchers write in a 2020 paper published in Science Advances. “The largest tropospheric column ozone (TCO) increases occurred above Malaysia/Indonesia, Southeast Asia, and India, followed by Northeast China/Korea and the Persian Gulf. With the exception of Northeast China/Korea, TCO increases above the midlatitude regions (North America and Europe) are much less.”

These findings are significant, said Cooper, because they confirm increases in tropospheric ozone concentrations and its radiative forcing (i.e., the change in the flow of energy in the atmosphere caused by natural or anthropogenic factors of climate change) in all 11 study regions. They also suggest that increases in NOx emissions across Southern, Southeastern, and Eastern Asia are impacting tropospheric ozone levels in Western North America.

Yet, while the amount of ozone in the troposphere has generally increased over the past century and a half, that increase hasn’t always been constant. For example, as Cooper and his colleagues documented in a 2022 study appearing in AGU Advances, a drop in tropospheric ozone concentrations occurred above Western North America and Europe in 2020, during the height of the economic slowdown resulting from the COVID-19 pandemic.

In that paper, lead author Dr. Kai-Lan Chang of CIRES and NOAA’s Earth Systems Laboratory, Cooper, and others investigated ozone trends and anomalies in the free troposphere using a new regional scale method for merging separate ozone time series. That method incorporated data from ozonesondes, JPL’s TMF Tropospheric Ozone Lidar, and the IAGOS database. To test it, the researchers focused on anomalies during the full 12 months of 2020.

The researchers reported an increase in ozone concentrations above Western North America and Europe from 1994 until 2019 and then an abrupt drop in ozone in 2020, which they attributed to the economic slowdown that occurred during the pandemic.

“We found that the positive 1994–2019 ozone trends above Europe and Western North America are diminished when including the large negative anomalies in 2020,” the researchers conclude in their paper. “2020 is the only year in which both regions show coincident and profound negative anomalies since the benchmark year of 1994.”

Given the extraordinary circumstances of the pandemic, Cooper and his colleagues said it is too early to tell if emissions over Europe and Western North America would return to their pre-COVID levels. To find out, they suggested that “continuous monitoring of free tropospheric ozone in 2021 and beyond” would be required to evaluate the impact of 2020 on long-term ozone trends.

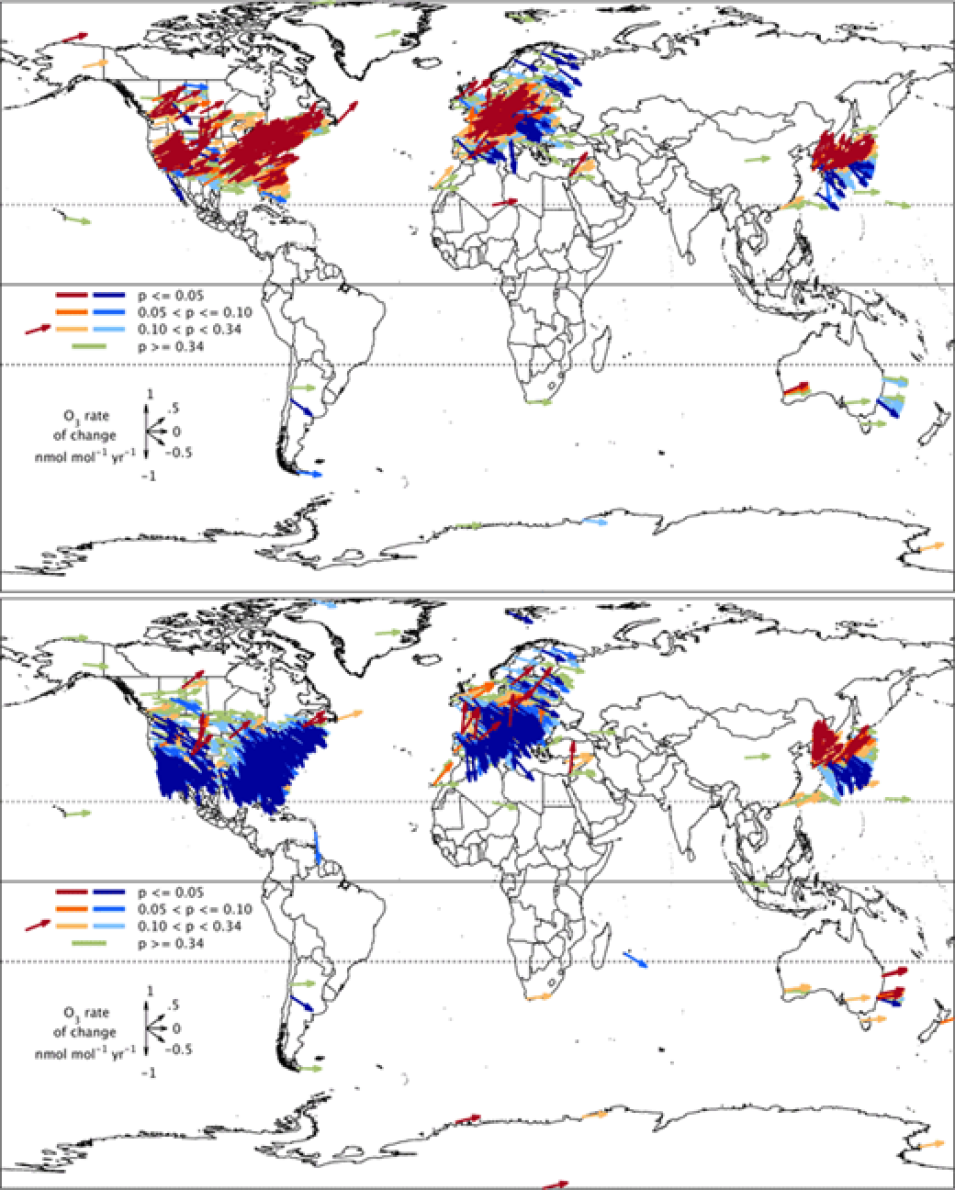
These maps (click link for larger image) show trends of daytime average ozone from 2000–2014 at 1375 non-urban sites in December–January–February (top) and 1784 non-urban sites in June–July–August (bottom). Blues indicate negative trends, oranges indicate positive trends, and green indicates weak or no trend.
Image Caption

These maps (click link for larger image) show trends of daytime average ozone from 2000 to 2014 at 1,375 non-urban sites in December, January, and February (top image) and at 1,784 non-urban sites in June, July, and August (bottom image). The number of available sites is greater in June, July, and August because most U.S. sites only operate in the warm season. Colored vector arrows indicate the probability (p-value) that a particular statistical measure will be greater than (orange arrows), less than (blue arrows), or equal to (green arrows) observed values for each site. Credit: Dr. Cooper.

Of course, Cooper and his colleagues in the TOAR initiative plan to continue doing just that, for in his words, “exciting things are happening” in the United States and Europe, and he’s eager to see when South and East Asia “are going to turn a corner.” And then there’s Africa, which Cooper refers to as “a big unknown.”

“[Africa] has a large and growing population, [its] energy consumption is going up, they’re using more and more fossil fuels, and we don’t have a lot of measurements from Africa. So that’s the big question mark,” he said. “The tropics are important because that’s where most of the world’s population is, there’s a lot of sunlight, and if you increase emissions in the tropics, you can make a lot of ozone, which then leaves the tropics and pollutes the rest of the world.”

It might seem like ozone-measuring instruments on the satellites operated by NASA and its partner agencies could provide those measurements, but according to Cooper, they aren’t receptive enough.

“Satellites fill a lot of the gaps, but they aren’t sensitive at the surface,” he said. “They can tell you how much ozone is in a full column of the atmosphere, but if you want to know what’s happening at the surface, they don’t have the necessary sensitivity.”

At least not right now. The Tropospheric Emissions: Monitoring of Pollution (TEMPO) instrument, which is scheduled to launch into space aboard the Intelsat 40e commercial satellite in April 2023, is expected to change that.

“TEMPO will be a game changer because it will have sensitivity in the lower troposphere. Not right at the surface, but definitely more sensitivity than all the other satellite products out there,” Cooper said. “That’s going to fill in a lot of the gaps near the surface. Then we can take those data from the instrument and ingest them into air quality forecast models to improve the forecasts of air quality and air pollution events.”

When data from TEMPO are available, NASA's ASDC will be there to archive and distribute them to researchers like Cooper and his colleagues who are working to monitor levels of ozone in the troposphere and track its movements around the globe.

Representative Data Products Used or Created:

Available through ASDC:

Other data products used:

Read about the Research:

Chang, K.-L., Cooper, O.R., Gaudel, A., Allaart, M., Ancellet, G., Clark, H., Godin-Beekmann, S., Leblanc, T., Van Malderen, R., Nédélec, P., Petropavlovskikh, I., Steinbrecht, W., Stübi, R., Tarasick, D.W., & Torres, C. (2022). Impact of the COVID-19 economic downturn on tropospheric ozone trends: an uncertainty weighted data synthesis for quantifying regional anomalies above western North America and Europe. AGU Advances, 3, e2021AV000542. doi:10.1029/2021AV000542

Gaudel, A., Cooper, O.R., Chang, K.-L., Bourgeois, I., Ziemke, J.R., Strode, S.A., Oman, L.D., Sellitto, P., Nédélec, P., Blot, R., Thouret, V., & Granier C. (2020). Aircraft observations since the 1990s reveal increases of tropospheric ozone at multiple locations across the Northern Hemisphere. Science Advances, 6, eaba8272. doi: 10.1126/sciadv.aba8272

Gaudel, A., Cooper, O.R., et al. (2018). Tropospheric Ozone Assessment Report: Present-day distribution and trends of tropospheric ozone relevant to climate and global atmospheric chemistry model evaluation. Elementa Science of the Anthropocene, 6(1): 39. doi:10.1525/elementa.291

Explore more Data User Profiles

Details

Last Updated

Data Center/Project

Atmospheric Science Data Center (ASDC)