Dr. Helen Poulos

Data from NASA’s Land Processes DAAC help Dr. Helen Poulos understand climate-induced change in the forests of the Southwestern U.S.

Dr. Helen Poulos, Adjunct Assistant Professor of Environmental Studies, Wesleyan University College of the Environment

Research Interests: Plant ecophysiology, community ecology, fire ecology, and forest hydrology.

Research Highlights: When Dr. Helen Poulos was in graduate school there were two classes that, as she puts it, “really kind of blew [her] mind.” The first was a remote sensing class, where she learned to manipulate satellite imagery and understand how different surfaces reflect light across the electromagnetic spectrum. The second, which she took during the same semester, was a methods in tree physiology class where she and her classmates took spectral reflectance measurements on individual leaves.

“Taking those two classes at the same time resulted in this aha moment,” Poulos said. “I thought, ‘Wow, I can actually take measurements on a leaf and then scale those measurements across landscapes or regions using satellite imagery. How cool is that?’”

This insight has not only stayed with her, it’s become a recurring theme in her research and in the lessons she imparts to her students.

“When we’re looking at satellite imagery I always ask my students, ‘What do you think is happening on the ground?’" Poulos said. “You can only tell so much about what’s happening on the ground from space, but if you have a good relationship between your observations from space and those from the ground, then you can scale those measurements across landscapes.”

Poulos teaches those students in Wesleyan University’s College of the Environment, where she serves as Adjunct Assistant Professor of Environmental Studies and conducts research on the way the forests of the Southwestern United States are changing in response to climate change and more severe, frequent, and widespread wildfires.

“Historically, fires [in the region] were frequent and occurred at regular 5- to 15-year intervals to clean out forest understories, keep fuel loads low, and prevent really big, hot, high-severity fires from coming through,” Poulos said. “These frequent fires were predominantly how our forests adapted to disturbances over long periods of time.”

Although these fires were common due to lightning and Native American burning practices, they began to occur less frequently in the late 1800s following the Euro-American colonization of the West, resulting in a build-up of fuels and changes to the region’s fire regime.

“Now, with climate change, what we’re seeing is really heavy fuel loads in forests that haven’t burned for more than a century. Now as they burn, we are seeing big changes in our forests,” Poulos said. “Forests are really struggling to survive and regenerate in this hotter, drier, fiery environment, so I’m using remotely sensed data to understand the relationships between fire severity and the patterns of vegetation in response to these more frequent, very hot, and very expansive fires.”

Of course, not every wildfire in the region is a high-severity conflagration burning hundreds of square miles. Some fires continue to burn as they once did, even with the build-up of fuels and the hotter, drier climate.

“Many fires are still burning as they did in the past, but in those places that are burning differently we’re seeing conversions from forest to non-forest,” Poulos said. “I am trying to figure out where fires are burning as they did in the past and where we’re seeing these really big transitions happening.”

Describing how fire regimes—the patterns of how fire burns on the landscape over time—are changing in the Anthropocene and how forests respond to them, comprises one part of her research. The other involves the use of remotely sensed data to inform forest management and restoration.

“The second part of my research is the applied part, which focuses on understanding what tools we can use to try to reduce fire and climate change risk to forests,” she said. “How can we use remotely sensed data and imagery to detect these changes and then use management [techniques] to create more climate- and fire-resilient forests?”

The data and imagery that Poulos uses in her work come from a variety of sources, including NASA’s Land Processes Distributed Active Archive Center (LP DAAC). Located at the USGS Earth Resources Observation and Science (EROS) Center near Sioux Falls, South Dakota, the LP DAAC ingests, processes, archives, and distributes data products related to land processes in NASA’s Earth Observing System Data and Information System (EOSDIS) collection. These data are crucial to the investigation, characterization, and monitoring of biological, geological, hydrological, ecological, and related conditions.

“In terms of imagery, Landsat is very important for mapping fire severity, and I use observations of post-fire forest hydrology and plant water cycling from the Ecosystem Spaceborne Thermal Radiometer Experiment on the International Space Station (ECOSTRESS) instrument,” Poulos said. “I also use Daymet Daily Surface Weather data from [NASA's] Oak Ridge National Laboratory Distributed Active Archive Center (ORNL DAAC), data from the European Space Agency’s Sentinel-2A and -2B satellites, the Advanced Spaceborne Thermal Emission and Reflection Radiometer Global Digital Elevation Model (ASTER-GDEM) product, and the Moderate Resolution Imaging Spectroradiometer (MODIS) gross primary productivity, fraction of photosynthetically active radiation, land surface temperature, and leaf area index products.”
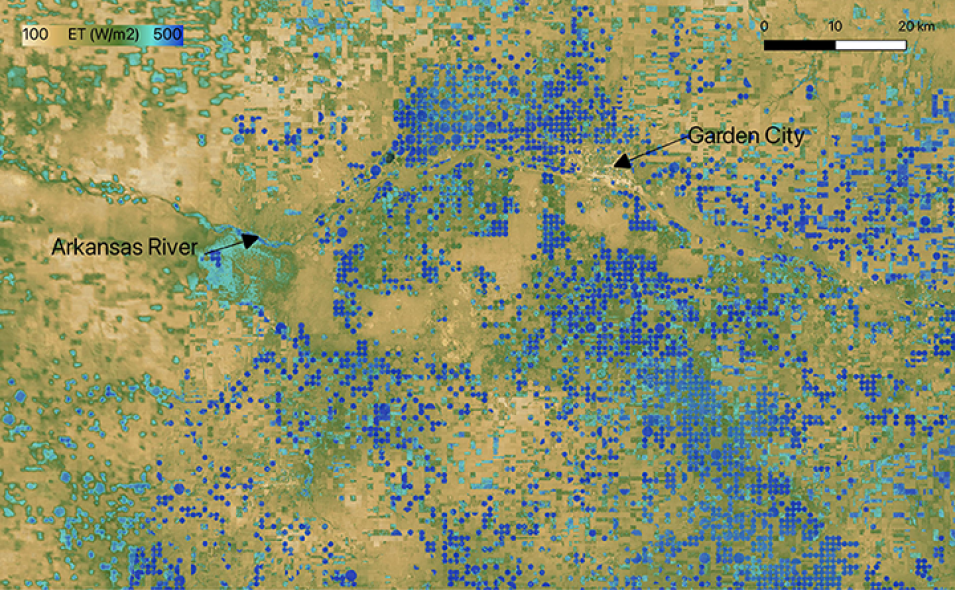
This August 2022 evapotranspiration (ET) image from ECOSTRESS shows areas of high ET (blue) over pivot irrigation circles around Garden City, Kansas, illustrating that the crops are releasing small amounts of water as they photosynthesize, indicating healthy vegetation. The unmanaged background is clearly drier and more stressed (tan colors), showing the impact of sustained drought.
Image Caption

This August 2022 ECOSTRESS evapotranspiration (ET) image shows areas of high ET (blue) over pivot irrigation circles around Garden City, Kansas, illustrating that the crops are releasing small amounts of water as they photosynthesize, which is an indication of healthy vegetation. The unmanaged background is clearly drier and more stressed (tan colors), showing the impact of sustained drought. Credit: NASA JPL.

In addition to these data products, Poulos regularly uses LP DAAC’s Application for Extracting and Exploring Analysis Ready Samples (AppEEARS) tool, which provides access to a wide array of geospatial data products (e.g., elevation, land cover, soil moisture, vegetation, and daily meteorological variables) for the contiguous U.S., and the Visible Infrared Imaging Radiometer Suite (VIIRS) 375-Meter Thermal Anomalies/Active Fire product from the Fire Information for Resource Management System (FIRMS), an online interface offering near real-time active fire data from NASA’s Land, Atmosphere Near-real-time Capability for EOS (LANCE).

Poulos finds these data products and tools valuable for both the measurements they provide and for their utility in testing and validating how different remotely sensed data perform in different types of forested environments after different types of disturbances.

“I work in very rugged, arid landscapes and sometimes remotely sensed imagery has limits in regard to spatial and spectral resolution. So, the question becomes ‘What are the limits to being able to use these data? Where do they work and where don’t they work?’” she said. “That’s one of the fun parts of research and I think it’s really important for informing people on how they can use these data, while recognizing their limitations.”

Poulos investigated these questions in a 2021 paper that examined the influences of the post-fire vegetation and fire severity on diurnal, seasonal, and multi-year variations in evapotranspiration (ET), or the movement of water from the soil to the atmosphere via plants. Typically, ET declines in areas that have experienced high-severity fire, but after analyzing the relationship between post-fire vegetation and ECOSTRESS ET data, Poulos and her team recorded elevated levels of ET at shrubland sites in southern Arizona that had burned at high severity.

“In this study, post-fire ET was driven by plant species composition and tree canopy cover [and] was significantly higher in the morning and midday in densely vegetated post-fire shrublands than pine-dominated forests that remained 5 to 7 years after wildfire,” Poulos and her co-authors write. “Our results demonstrate that plant functional traits such as resprouting and desiccation tolerance drive post-fire ET patterns and they are likely to continue to play critical roles in shaping post-fire plant communities and forest water cycling under future environmental change.”

These results are noteworthy, both for what they reveal about water cycling in fire-converted shrublands and for what they suggest about the utility of ECOSTRESS data in ecological research.

“We were the first to show high ET in these fire-converted shrublands relative to the historical kind of forest that did very well in frequent, low-severity fire regimes. What we’re seeing is that post-fire shrublands that have converted from forest in response to high-severity fire are growing vigorously in the post-fire landscape and cycling a lot more water through the landscape than the pine-oak forests that prevailed under frequent low-severity fire—and we are able to detect that because of ECOSTRESS,” Poulos said. “One of the things that’s cool about this is it allows us to see things [that once required] field measurements at all of these plots, but ECOSTRESS allows us to get 1- to 7-day data about water cycling during different seasons, different times of day, and different years.”

Poulos further evaluated applications of ECOSTRESS data in a second, more recent paper published in 2023. Along with lead author Andrew Barton of University of Maine at Farmington and colleagues from Northern Arizona University, Poulos investigated the regeneration patterns of two pine species (Pinus engelmannii and P. leiophylla) during a period of severe drought 10 years after the Horseshoe Two Megafire in Arizona’s Chiricahua Mountains. To conduct this study, Poulos and her colleagues evaluated whether Landsat 8 normalized difference vegetation index (NDVI) data or ET data from ECOSTRESS were more useful in aiding their understanding of the post-fire vegetation patterns on the landscape.

Past research demonstrated that topography and fire severity influenced pine recruitment across environmental gradients and, indeed, Poulos and her colleagues found these factors to be important predictors of pine regeneration patterns.

“Our research . . . revealed . . . limited pine regeneration and conversion of Madrean pine-oak forest to oak shrublands was predominantly driven by two uncharacteristically large and severe wildfires under extreme moisture deficits,” the researchers write. “Loss of the pine component is particularly true for P. engelmannii, whereas P. leiophylla has eked out a future in these post-fire sites. Projections of intensification of drought and high-severity wildfire in the future suggest that the vegetation changes documented in this study will continue.”

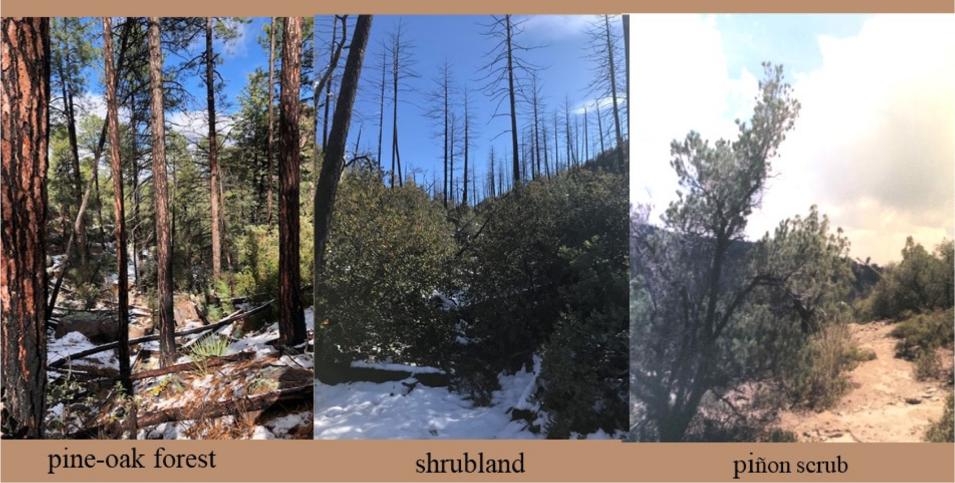
These three photos show the dominant post-fire vegetation types -- pine oak forest (left), shrubland (middle), and pinion scrub (right) -- 5–7 years after the 2011 Horseshoe Two Fire. Pine-oak forests and piñon scrub maintain a mixture of pines and oaks after wildfire, while post-fire shrublands are characterized by standing dead pines that were killed by the fire and post-fire recovery by resprouting tree species.
Image Caption

Photos of the three dominant post-fire vegetation types 5 to 7 years after the 2011 Horseshoe Two Fire. Pine-oak forests and piñon scrub maintain a mixture of pines and oaks after wildfire, while post-fire shrublands are characterized by standing dead pines that were killed by the fire and post-fire recovery by resprouting tree species. Image courtesy of Dr. Poulos.

They also found the Landsat 8 NDVI data, which are used to quantify vegetation greenness and are useful in understanding vegetation density and assessing changes in plant health, to be a more beneficial metric for tracking and predicting post-fire forest regeneration than the ECOSTRESS ET and evaporative stress index data.

“We found that Landsat NDVI, with its 30-meter resolution, did a better job than ECOSTRESS at explaining the patterns of where pines are regenerating and where they aren’t,” Poulos said. “Remotely sensed data [are] valuable because [they provide] an opportunity to think about the mechanisms [driving] forest change. High-severity fires are transitioning our forests to non-forest grass and shrubland, and by using remotely sensed imagery to look at the recovery trajectory over time, we can get at why we are seeing pine regeneration on some sites and not on others.”

In addition to using remote sensing to study the regeneration of pine forests, Poulos is also working with Wesleyan University graduate student Jenna Otaola, on a project that uses remote sensing to identify the drivers of fire severity. (A paper on this research is forthcoming.)

“We used a variety of different geospatial predictor variables, including ECOSTRESS, to try to understand the key factors influencing fire severity in 58 wildfires in Arizona from 2019 and 2020,” Poulos said. “[Jenna] was able to show that in years with more critical drought stress, such as 2022, data from instruments like ECOSTRESS are important because water cycling, fuel moisture, precipitation, and other parameters are critical variables for predicting fire severity.”

Knowing what factors lead to greater fire severity can help land managers make more effective decisions to mitigate wildfire risk in Western landscapes.

“Understanding the drivers of low and moderate severity fire is really important for planning,” said Poulos. “Managers can decide not to treat areas that have a high probability of burning at low severity, or they might consider the impact of prior disturbances and vegetation moisture when planning management activities.”

As these research findings suggest, Poulos has capitalized on that aha moment by enlisting space-based remote sensing data in her ongoing efforts to improve the climate- and fire-resilience of forests in the American Southwest. They also point to the critical role of NASA’s LP DAAC in providing scientists like Poulos the data they need to detect and track patterns of environmental change.

Representative Data Products Used or Created:

Available through LP DAAC:

Other data products and resources used:

Read about the Research:

Otaola, J.L. & Poulos, H.M. (In Preparation). Topohydrological Influences on Arizona Wildfire Severity, USA. To be submitted to Forest Ecology and Management.

Barton, A.M., Poulos, H.M., Koch, G.W., Kolb, T.E., & Thode, A.E. (2023). Detecting patterns of post-fire pine regeneration in a Madrean Sky Island with field surveys and remote sensing. Science of The Total Environment, 161517. doi:10.1016/j.scitotenv.2023.161517

Poulos, H.M., Barton, A.M., Koch, G.W., Kolb, T.E., & Thode, A.E. (2021). Wildfire severity and vegetation recovery drive post‐fire evapotranspiration in a southwestern pine‐oak forest, Arizona, USA. Remote Sensing in Ecology and Conservation, 7(4): 579-591. doi:10.1002/rse2.210

Explore more Data User Profiles

Details

Last Updated

Data Center/Project

Land Processes DAAC (LP DAAC)