Visualization and data analysis are critical components of scientific research. The drive for research to be more interdisciplinary and the ongoing increase in volumes of data both pose numerous challenges. Large datasets need to be processed while, simultaneously, multiple three-dimensional datasets (such as lightning source observations from a lightning mapping array) need coincident visualization.

Coincident visualization refers to the ability to accurately plot geolocated datasets at the same time. The image below shows cloud cover from the Advanced Baseline Imager (ABI) instrument (white areas), source observations from the lightning mapping array (purple and blue colors), and the flight track of the ER-2 aircraft (green lines). Each of these data sources is overlaid on a map layer that provides political map details and major roads.
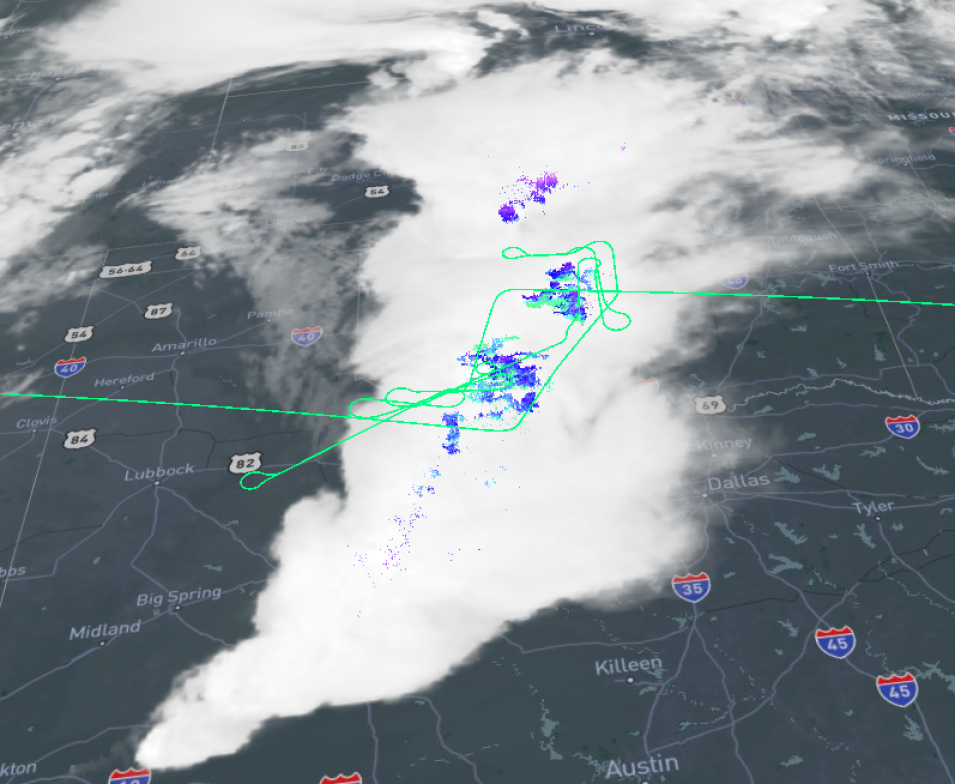
image showing clouds over a street map with colors indicating rain and green lines indicating flight paths
Image Caption

Example of coincident visualization showing multiple geolocated data elements combined on a single image. This enables the analysis of data layers in three dimensions. Credit: NASA's GHRC DAAC.

NASA's Global Hydrometeorology Research Center Distributed Active Archive Center (GHRC DAAC) has been developing a cloud-based visualization and analysis system to display numerous datasets at the same time in three dimensions. Building from GHRC's diverse Earth science data holdings, particularly field campaigns, this effort has resulted in a stand-alone system called the Field Campaign Explorer (FCX) that enables users to create their own application programming interface (API) plugins and provides Jupyter Notebook data recipes that allow users to see how files can be opened and manipulated. While developed for work with field campaign data, FCX is capable of working with a broad range of datasets beyond those associated with field campaigns.

This presentation covers the origins of this work, showcases example workflows, and highlights current efforts to develop this into an enterprise-level tool for dataset visualization and analysis.

Documents

Access slides, guide documents, and other resources related to this event.

SHOWING 1 OF 1

Details

Last Updated

Published

Data Archive

GHRC DAAC