The Un-Ice Age

Earth’s remaining ice sheets head for the ocean.

Six hundred and fifty thousand years ago, mammoths and mastadons cavorted on the plains of North America, on the fringes of a massive sheet of ice almost two miles thick in places and as big as a continent, covering most of what are now Canada and the upper United States.

Earth warmed, and the ice sheets receded, so people can now live in places once buried by ice like Quebec and Chicago. Correctly speaking, Earth remains in an ice age. Ice still sits thick atop Greenland and Antarctica, holding enough water to raise sea levels by hundreds of feet; and in recent decades, the ice sheets have begun to melt more rapidly.

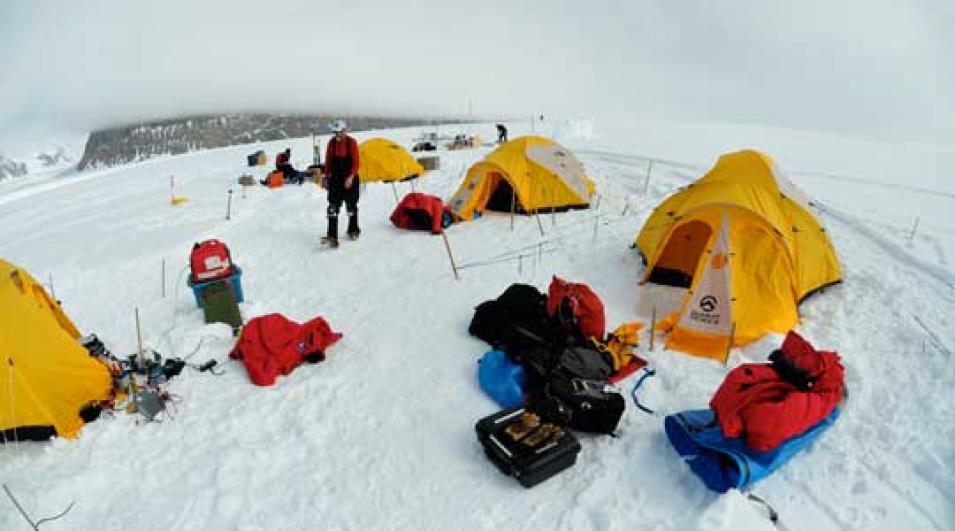
Photograph of a base camp on the Antarctic Ice Sheet

Is global warming pushing Earth into an ice-free age? Scientists doubt a total melt this century, but think there could be enough to raise sea levels up to three feet. Only a foot or two could drive millions of coastal dwellers to higher ground. A closer estimate of the potential for sea level rise from ice sheet melting would give low-lying communities around the world more time to figure out how to adapt.

Icing up

Water on Earth resides in liquid form in the ocean, lakes, rivers, and underground, in moisture form in the air and soil, and in solid form as ice and snow. The total amount of water on Earth is more or less constant. Water can redistribute within the Earth; the water contained in the massive ice sheets on land during the ice ages originated from the oceans. As a result, at the peak of the ice ages, sea levels were 400 feet lower than they are today.

Today Earth is in an interglacial period, a relatively warmer period of the current ice age, but in recent decades Earth’s climate has been warming. While past shifts took hundreds or thousands of years, today people may be able to see changes in their lifetimes. Only a few degrees of cooling or warming can alter the balance between ice age and ice melting, and the beginnings of that melt are evident. Ted Scambos, a glaciologist at the National Snow and Ice Data Center (NSIDC) said, “Greenland mass loss started in the most likely place—at the southern glacier outlets—then spread to the rest of the island. In Antarctica, it started at the northernmost point on the Antarctic Peninsula, and on the coast of the West Antarctic Ice Sheet, at Pine Island Bay.”

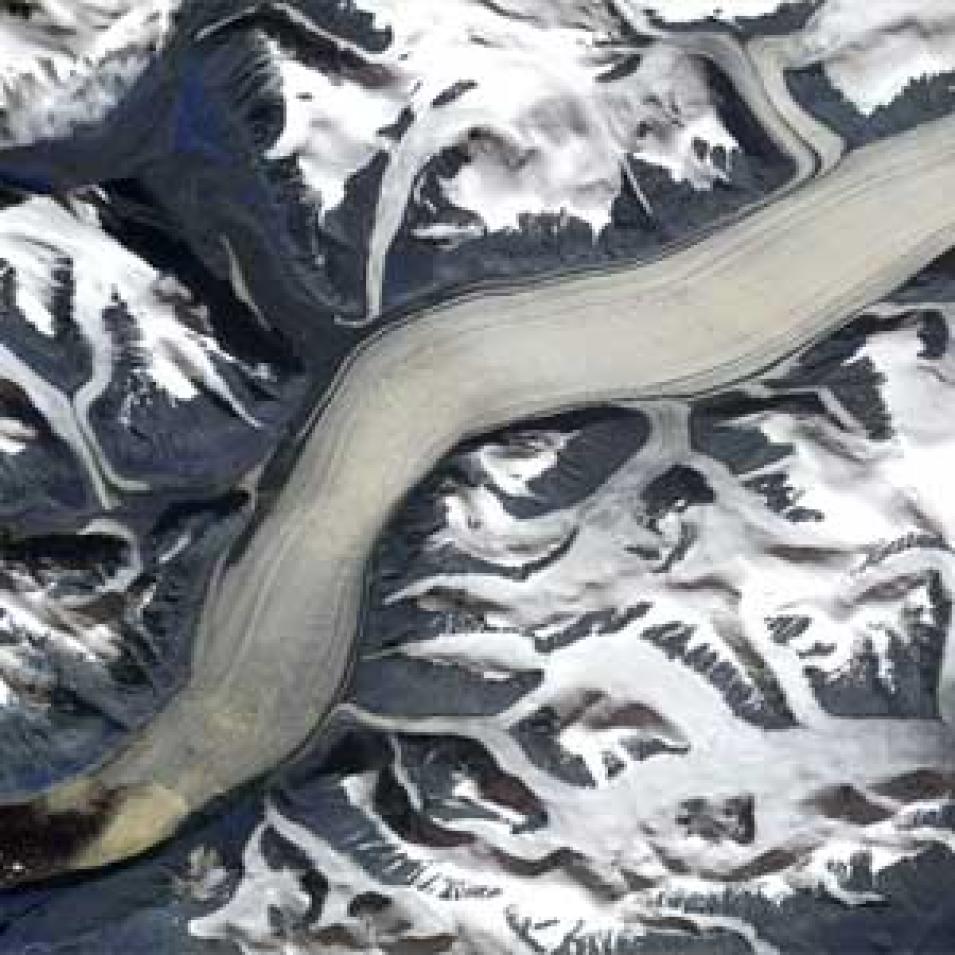
Satellite photo of Umiamiko Glacier in Greenland

Isabella Velicogna, an assistant professor at the University of California, Irvine, said, “It’s hard to make long-term predictions, but we see that things are changing fast.” The questions pile up like the ice once did: How fast is it melting? How much will sea levels rise, and when? What will this mean to people along low-lying coasts?

Melting down

What scientists know about how these ice sheets grow and shrink has been hard won. They have dragged sled-mounted radars across the vast Antarctic continent to probe its ice cover. They planted gauges on glaciers to monitor their shedding of ice towards the sea. They camped on Greenland’s ice sheet to watch melt water pour down deep drain holes that pock the ice sheet in summer. They combed satellite imagery for changes to the outlines of the ice sheets, and saw the sudden collapses of ice shelves that fringe Antarctica’s edges. In recent decades, they have witnessed telltale signs of warming unlike any in the last thousand or more years.

But putting absolute numbers on the cubic feet of ice on land, and the melt water flowing into the oceans, is a slippery problem. It meant figuring the amount of ice being added as snowfall, and subtracting ice and melt water flowing into to the ocean. Scambos said, “We didn’t have enough measurements of snow accumulation in Antarctica, so when earlier models estimated the mass input to the ice sheet, they could be slightly off in the middle of the ice sheet. That can add up to a lot over a huge area.”

Glaciers on Greenland and Antarctica have also changed rapidly in recent decades. Large shelves of ice floating on the ocean in front of outlet valleys, where glaciers shed their ice into the ocean, help slow glaciers down. The warming of recent decades has resulted in the break up and rapid collapse of several ice shelves. “When the glaciers were suddenly freed from the gate, they began galloping along,” Scambos said.

New information came from NASA's Ice, Cloud, and Land Elevation Satellite (ICESat), which used a laser to measure the height of the ice sheet. Launched in 2003, it was providing a clearer picture of ice thickness when it ceased operations in 2010. NASA filled in with a series of missions with sensors flown on aircraft, called Operation IceBridge, and has planned a second ICESat mission in 2015. “IceBridge is giving us a cross section of glaciers, a gallery of detailed descriptions,” Scambos said. But the big picture is still elusive, and the ice sheets are not waiting.

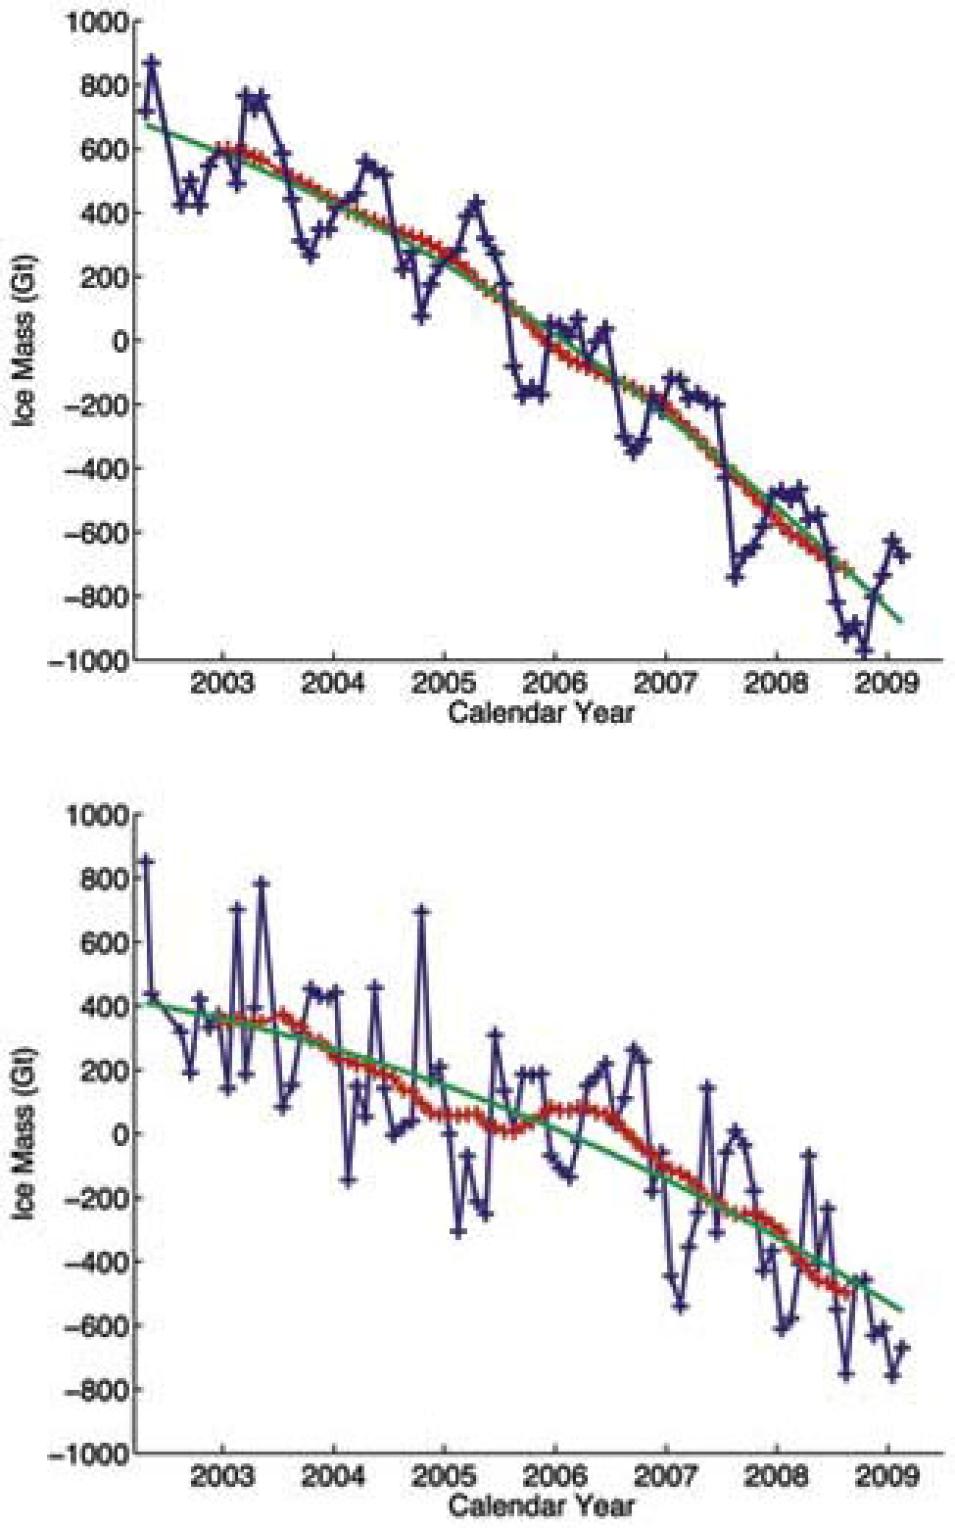
Data images showing ice loss in Greenland and Antarctica

A quicker picture

Seeking more data on the changes, Velicogna and others turned to a very different source. “The Gravity Recovery and Climate Experiment (GRACE) satellites weigh the Earth every thirty days and look at how the mass is changing,” Velicogna said. “We can see many things, like water storage on land, and how much ice is stored on the ice sheets. You can see the changes in mass month to month.”

GRACE, a joint mission of NASA and the German Space Agency, does not actually weigh the Earth; it measures Earth’s gravity. Gravity varies with changes in mass: it varies slightly with latitude and elevation, and with geology, like denser rocks or mountains. The twin GRACE satellites orbit in tandem, measuring micrometers of change in the distance between them, caused by small deviations in gravity.

Changes in the location of water or ice on the Earth surface also cause gravity variations. GRACE picks up the gravity signal of the ice sheets, and scientists can measure how the signal changes as the sheets change. In 2009, Velicogna isolated the gravity data for Greenland and Antarctica, turning the data into mass change measurements. She compared mass from month to month and year to year since the satellites launched in 2002. Now she had data on how it changed—and mass change could be converted directly into water volume.

Though scientists suspected that the ice sheets were losing ground, the rate surprised them. According to the GRACE data, Greenland had been losing mass at a rate of 137 billion tons, or gigatons, per year, during 2002 to 2003. (A gigaton equals the weight of about 142 million African elephants.) By 2007 to 2009, the loss had accelerated to 286 gigatons per year. More startling was that Antarctica’s mass loss also sped up dramatically, from 104 gigatons per year to 246 gigatons per year.

The GRACE data may help the rate of scientists’ understanding match the accelerating rate of ice sheet change. Velicogna said, “We really need a longer record. We have made incredible improvements over the last decade in our understanding of Antarctic mass balance. Before GRACE, we thought that Antarctica would gain mass.” Warmer air temperatures cause more snow to fall on the interior of Antarctica, helping it gain mass. Scambos said, “Isabella’s study using the GRACE data, and other studies, show that increased snowfall is not enough to offset the loss at the coasts.”

Scientists are still working to zero in on the rate of change likely over coming decades. However jagged the line of descent may be, it is pointed downward. Scambos said, “When her study came out, and we saw the trend, it was a bad surprise. It will not go down this road slowly—it will pick up speed. It is not going away.”

Future coastlines

How sea level change will change our coasts is no straight-line problem either. The ocean is not like a flat pan of water that rises equally when water is added. Velicogna said, “If you take a boat and sail the ocean, take your GPS and measure elevation, you see that the ocean is not flat. Gravitational pull shapes the sea surface. If you put more water in the ocean, it will go to the lowest point. So in some places, sea level will rise more than others. In addition there are waves and tides.” Millions of people around the world live in low-lying deltas that scientists think will be under water in coming decades.
Photograph of Punchbowl Glacier in Antarctica

“We have to think about what we can do to mitigate the changes,” Velicogna said. “It is not going to happen today or tomorrow, but eventually. If we are a rich country we can build a different house, but it has a cost. There are places such as Bangladesh that are not so rich.”

Even better-off economies will change, as people move from low-lying areas to higher ground. “It takes time to adapt,” she said. “People in places like the Netherlands that are already below sea level are more concerned than people in the U.S.”

While the future can be troubling to think about, scientists like Scambos and Velicogna are optimistic that scientific knowledge will help us adapt to a new age with smaller ice sheets and bigger oceans. Velicogna said, “It’s a great field to be in, that’s what I say to the students. It’s great that we have all these satellite data. There is a lot we can learn.”

References

Climate change past and future: The Ice Ages.

Khan, S. A., J. Wahr, M. Bevis, I. Velicogna, and E. Kendrick. 2010. Spread of ice mass loss into northwest Greenland observed by GRACE and GPS. Geophysical Research Letters 37, L06501, doi:10.1029/2010gl042460.

Scambos, T. A., J. Bohlander, C. Shuman, and P. Skvarca. 2004. Glacier acceleration and thinning after ice shelf collapse in the Larsen B embayment, Antarctica. Geophysical Research Letters 31, doi:10.1029/2004GL020670.

Velicogna, I. 2009. Increasing rates of ice mass loss from the Greenland and Antarctic ice sheets revealed by GRACE. Geophysical Research Letters 36, L19503, doi:10.1029/2009GL040222.

For more information

NASA Physical Oceanography Distributed Active Archive Center (PO.DAAC)

Gravity Recovery and Climate Experiment (GRACE) Tellus

Isabella Velicogna

Ted Scambos

Quick Facts on Ice Sheets

About the remote sensing data used
Satellite Gravity Recovery and Climate Experiment (GRACE)
Sensor K-Band Ranging System
Data sets GRACE Level 2 Products
Resolution 1 degree
Parameter Gravity fields
DAAC NASA Physical Oceanography Distributed Active Archive Center (PO.DAAC)
This study used GRACE gravity field solutions generated at the Center for Space Research at the University of Texas.

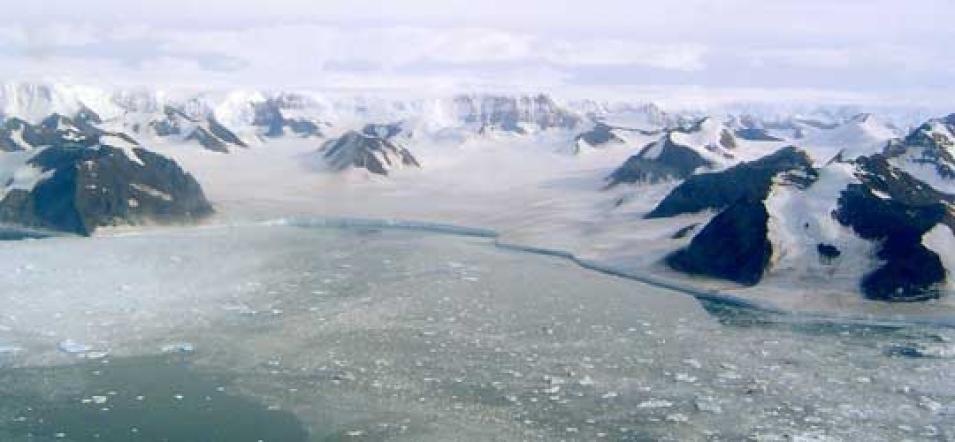
Photograph in the title graphic shows the seaward edge of Larsen B Ice Shelf. (Courtesy T. Scambos)

Details

Last Updated

Published

Data Center/Project

National Snow and Ice Data Center DAAC (NSIDC DAAC)
Physical Oceanography DAAC (PO.DAAC)