In the dense, dark night of the oak-hickory forest in the Ozarks, the soil breathes. Burrowing worms, twitchy protozoa, and roots of all sizes join the imperceptible breath that the forest soil takes, inhaling oxygen from air pockets in the earth and exhaling carbon dioxide (CO2) that wafts up into the tree canopy. At sunrise, billions of forest leaves would take what the soil exhaled during nighttime and give something back, sucking in CO2 for the hard work of photosynthesis, and releasing oxygen to complete the exchange.
The Secrets of Leaves
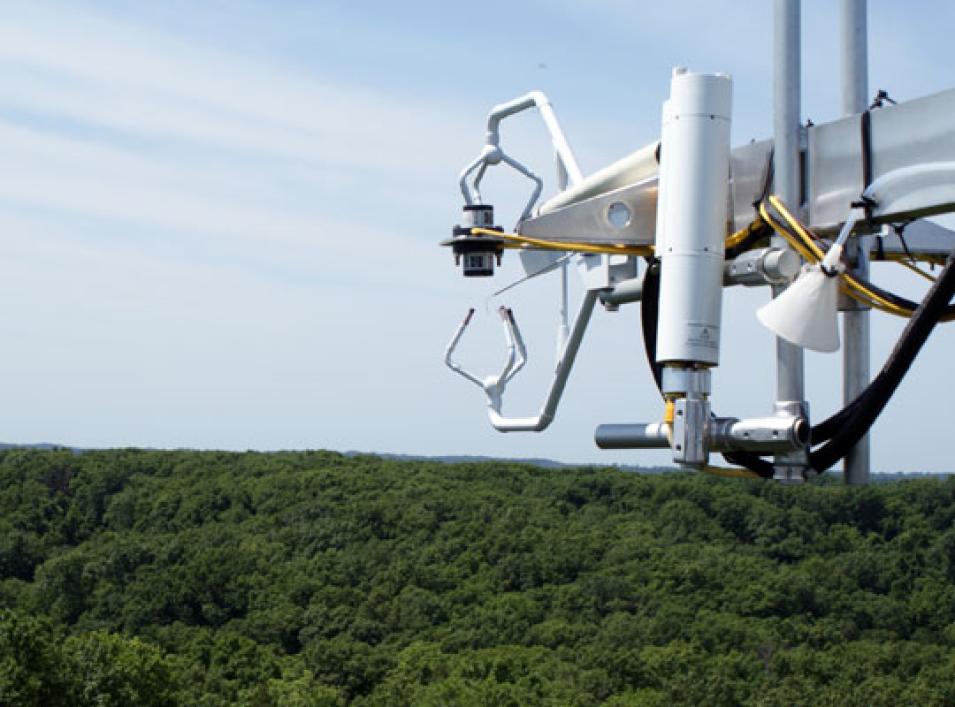
This silent exchange between land and air is what scientists call a carbon flux, a key piece of Earth’s much larger carbon cycle. Somewhere in this temperate forest is a 100-foot tower with prongs and probes that can measure these fluxes. Like a Godzilla-sized breathalyzer, it scans the air for answers. How strong was that waft of air? How much CO2 was in it? How moist was it? How warm or cool?
Researchers such as Kevin Schaefer at the University of Colorado Boulder read these fluxes like a vital sign of the planet’s health. They use computer models of the fluxes to understand how this exchange between land and the air will react to future scenarios, such as a much warmer Earth. Studies say that plants can grow up to 75 percent more if CO2 doubles in the atmosphere. Will this and longer growing seasons be the norm, or will drought be a stronger player? How much will ecosystems change? Scientists are turning to these models for answers; yet how reliable are they to begin with? “We need models that we can trust today if we are going to make predictions about the future,” Schaefer said. “But right now, these fluxes are a primary source of uncertainty in projections of future climate.”
Worms versus leaves
For carbon flux modelers, it all boils down to things that produce CO2, and things that absorb it. That means worms, rotting plants, decomposing critters, and all manner of bacteria that exhale CO2 are thought of as respiration. On the other hand, the humble leaf gets its own label: photosynthesis. To measure flux, researchers subtract the amount of CO2 absorbed by leaves during photosynthesis from the amount released during soil respiration. “You’ve got your tower and your vegetation, like a tree, and CO2 is going up and down, being exchanged, and helped along by vertical wind,” Schaefer said.
Many models simulate this recipe for carbon flux, some using satellite data, some built for crop prediction or timber inventory, and some designed for bigger carbon cycle models. In 2009, Schaefer was one of the leaders of a group of seventy volunteer scientists in scrutinizing some forty different models by comparing their simulated fluxes with actual fluxes observed by towers scattered all over the forests and grasslands of North America. After several years of comparing model against model, and simulations against observations, the researchers faced results that were disappointing. “Overall, the models did not perform that well, which was unfortunate, but true,” Schaefer said.
However, odd results in the study gave them important clues on how to improve the models. “We thought some models would do better than others, but this was not the case,” Schaefer said. “Rather, some tended to do better in some types of landscapes than others.” The models did best in forested sites, like the Ozarks flux tower site, but did badly in grassland sites. “They performed well in wet sites, but were the worst in dry sites,” Schaefer said. The question was, why?
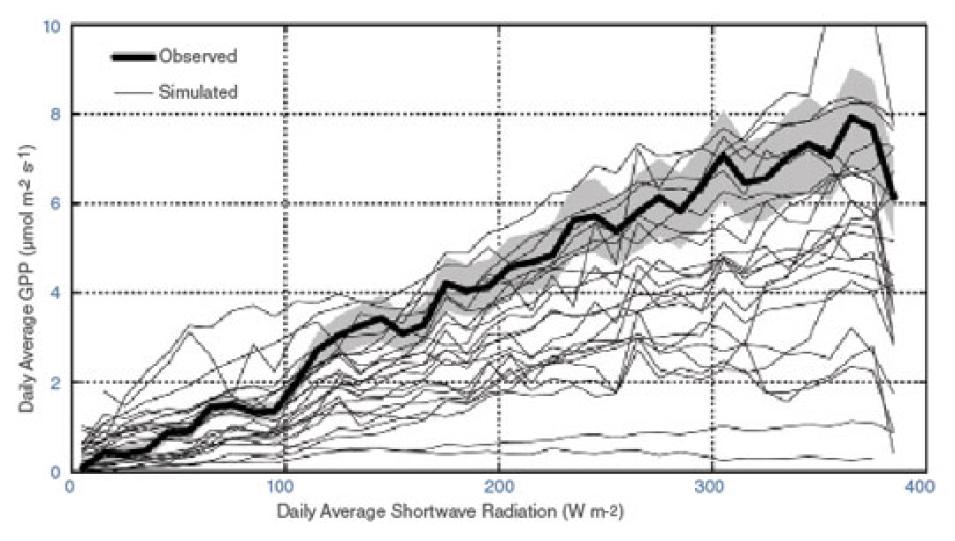
This graph shows simulated (gray lines) and observed (bold black line) Gross Primary Productivity (GPP) or photosynthesis as a function of daily average sunlight. The gray bar indicates uncertainty in the observed photosynthesis response to sunlight. Zero photosynthesis indicates winter and the peak indicates summer. Most modeled values did not match the observed values. (Courtesy K. Schaefer et al., 2012, Journal of Geophysical Research)
All in the stomates
“We realized that the models needed to represent drought stress and humidity stress better,” Schaefer said. “When leaves do the magic of photosynthesis, they open up their stomata, suck in CO2, and release water. When the soil is dry, plants cannot afford to lose water, so the stomata close down. But this also shuts down photosynthesis. And that’s drought stress.” Dry air causes the same reaction in leaves, called humidity stress.
The models need to better simulate the shutdown of photosynthesis during these two stresses. It is a crucial kink to fix. “It’s extremely important that we understand how the carbon cycle is going to change as temperatures rise,” Schaefer said. “We know that when it is hot enough, photosynthesis slows down. Does that mean respiration will overtake it in a much warmer climate?” Schaefer said, noting that this scenario means more CO2 sticking around in the atmosphere.
The researchers also found that the models need to better simulate the peak of photosynthesis in the summer. Photosynthesis does not occur in certain areas in the winter, because low temperatures cause leaves to fall off and other plants to go dormant. “Photosynthesis peaks in the summer when the temperature is high, the air is moist, and it’s the peak of the growing season,” Schaefer said. Then photosynthesis drops off again in the fall when it gets cold and the leaves fall. “You’ve got this seasonal cycle,” Schaefer said. “Photosynthesis starts at zero in winter, goes up in spring, peaks in summer, and then goes down in autumn. You can see this in the flux tower observations pretty plainly.” Although the models simulated winter and summer correctly, none of them were able to estimate when photosynthesis started in the spring and none got the peak rate of photosynthesis quite right. “They were all over the place,” Schaefer said. “Too high, too low, whatever.”
Randomness
After picking the models apart once more, the researchers found a flaw in the way they calculate the photosynthetic power of the entire canopy. “Most models calculate photosynthesis for a single leaf at the top of a tree’s canopy, and scale it up for the rest of the canopy,” Schaefer said. “So knowing the number of leaves is very important, knowing how photosynthesis scales up to all these leaves is important, and knowing what the photosynthetic capacity of that one leaf at the top is key.”
In computer models, it may not be easy to estimate the photosynthetic capacity of hundreds of leaves based on one leaf at the top of the tree. “In real life it may depend on a lot of things the models may or may not have,” Schaefer said. “Models tend not to be random. They move toward an average condition, whereas real life is more random. You are comparing real life to a model. It is hard to represent this randomness in computer models.”
One of these random unknowns is how much nitrogen is contained in every single leaf in a canopy. “A single leaf’s power to perform photosynthesis is essentially a measure of how much nitrogen it has,” Schaefer said. Nitrogen is a key nutrient needed in photosynthesis. Plants get the nitrogen they need from the atmosphere, soil, and human activity, like fertilizer application and air pollution. “That is what is missing here,” he said. “We need to get a better idea of that parameter, and it’s not easy to measure in the field.”
Carbon flux models have a way to go before they can simulate nature close enough to predict future fluxes. Schaefer and his colleagues are collaborating with ecologists and plant physiologists who have the leaf nitrogen and photosynthesis data that might be right for the models. He said, “Ecologists observe many, many things, and we have to communicate to them what things we think are most important to us as modelers.” Then it is back to work on the models, which Schaefer describes as a continuous balancing act. “Models are like balloons,” he said. “You push them in here and they bulge out on the other side. You fix one problem, you might break something else.”
References
Barr, A.G., et al. In press. NACP Site: Tower Meteorology, Flux Observations with Uncertainty, and Ancillary Data. Oak Ridge, Tennessee USA: NASA Oak Ridge National Laboratory (ORNL) DAAC.
Chapin III, F. S. 2006. Reconciling carbon-cycle concepts, terminology, and methods. Ecosystems 9: 1,041–1,050, doi:10.1007/s10021-005-0105-7.
Law, B. E. et al. 2008. Terrestrial Carbon Observations: Protocols for Vegetation Sampling and Data Submission. Global Terrestrial Observing System, 55, Rome, Italy.
Oak Ridge National Laboratory (ORNL) Distributed Active Archive Center (DAAC). 2013. FLUXNET Web Page. Available online from NASA's ORNL DAAC, Oak Ridge, Tennessee USA.
Ricciuto, D. M. et al. In press. NACP Site: Terrestrial Biosphere Model and Aggregated Flux Data in Standard Format. Oak Ridge, Tennessee USA: NASA Oak Ridge National Laboratory (ORNL) DAAC.
Schaefer, K., et al. 2012. A model-data comparison of gross primary productivity: Results from the North American Carbon Program site synthesis. Journal of Geophysical Research 117, G03010, doi:10.1029/2012JG001960.
For more information
NASA Oak Ridge National Laboratory Distributed Active Archive Center (ORNL DAAC)
Modeling and Synthesis Thematic Data Center
North American Carbon Program (NACP)
| About the data used | |
| Sensor | Eddy covariance sensor from AmeriFlux |
| Data set | North America |
| Resolution | 1 kilometer |
| Parameter | Eddy covariance |
| DAAC | NASA Oak Ridge National Laboratory Distributed Active Archive Center (ORNL DAAC) |
The photograph in the title graphic shows the leafy canopy in the Ozark National Forest, Arkansas. (Courtesy OakleyOriginals)


