Probing the Black Current

Satellites and ocean bottom instruments tell similar stories.
author-share

Physical oceanographer Jae-Hun Park helped steady a pumpkin-sized, plastic-encased glass ball on the deck of the Research Vessel Melville. The ball contained scientific sensors and had been moored to the sea floor off the eastern coast of Japan for two years, collecting data about the rapidly flowing ocean current above it. Forty-two other such glass balls either had been retrieved or were still moored underwater. Park would spend almost a month at sea with other researchers, retrieving these instruments. But he was very excited about the data they would be getting on the eddies, gyres, and meanders that make up the most active region of the Kuroshio Current.

The Kuroshio, one of the three largest of the world’s ocean currents, has long fascinated humans. Early fishermen and explorers took note of these currents because they either sped up their voyages or got them lost. Early Chinese mariners called the Kuroshio Current Wei-Lu, or the current to a world from which no man has ever returned. The Japanese named it Kuroshio, or black current, for its dark, cobalt blue waters. Physical oceanographer Steven Jayne said, “The Kuroshio is the strongest current in the Pacific Ocean, and is also one of the most intense air-sea heat exchange regions on the globe. It influences climate as far as North America.”


Image
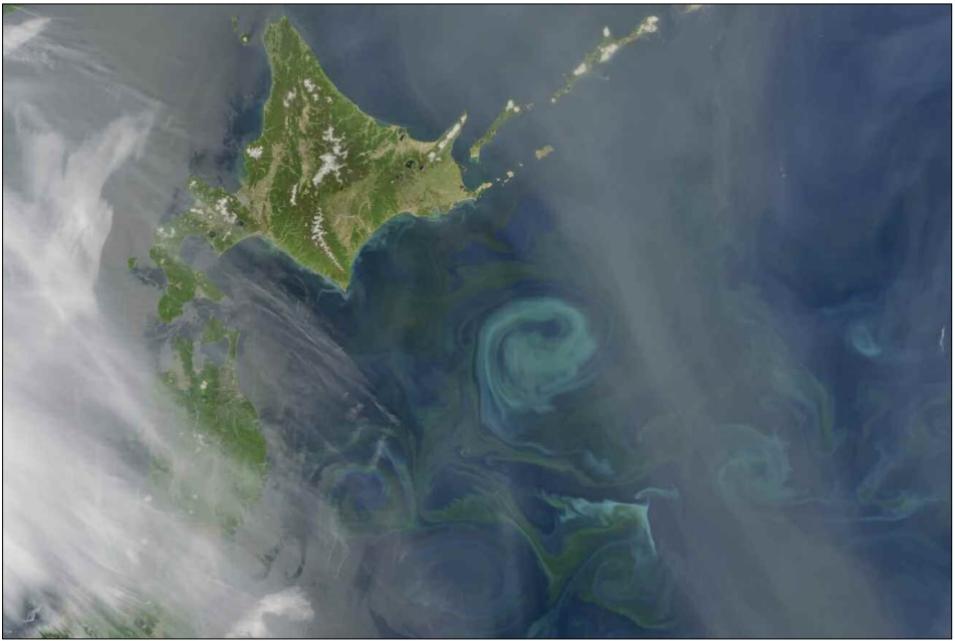
Kuroshio phytoplankton bloom
In this image from the NASA Aqua satellite, a swirling phytoplankton bloom becomes visible from space when warm waters from the Kuroshio Current collide with the frigid waters of the Oyashio Current off the eastern coast of Japan. (Courtesy N. Kuring, MODIS Ocean Color Team)

Mapping the Wei-Lu

Just as the Kuroshio was mysterious to early mariners, much about it remains unknown to scientists studying its connections to climate. “There have been many studies about the Gulf Stream in the Atlantic Ocean, but there haven’t been enough studies of the Kuroshio, which is the biggest and most important current in the North Pacific region,” said Jayne, an expert on global ocean dynamics and one of the lead scientists of the Kuroshio Extension System Study (KESS). “We wanted to study the fluid dynamics of this current because it’s interesting physics.”

The Kuroshio flows particularly fast and deep, flowing at a rate of 2.5 meters (8.2 feet) per second and as deep as 1,000 meters (3,281 feet) below the surface. Driven by winds and the Earth’s spin, it begins its journey in the tropical Philippine Sea and flows north to glide against Taiwan. When it reaches Japan, it is jolted into numerous eddies as it collides with a frigid, subarctic countercurrent from the Bering Sea. The current then vigorously meanders here and there, until it forms a free jet, shooting east toward North America, before it finally feeds into the larger North Pacific Ocean Gyre. Scientists think surface currents like the Kuroshio influence the path of hurricanes and typhoons, and affect climate in surrounding regions.

With data from a combination of drifting robotic probes, a sensor-mounted buoy, satellite data, and underwater sensors, KESS found recirculation gyres swirling both to the north and south of the Kuroshio jet. Jayne said, “We knew there was one to the south, but we didn’t know there was one to the north before the KESS study.” Recirculation gyres are spinning currents of water that are isolated from the surrounding circulation. “They can be places where fish and larvae can be moved around for long periods of time because water is just recirculated around and around,” Jayne said. Scientists are interested in the Kuroshio’s gyres because these are some of the few places in the ocean where subtropical mode water is formed. Subtropical mode water is a layer of water with exceptionally uniform temperature and salinity that is believed to help stabilize climate in a region. The KESS study also successfully produced maps of how the Kuroshio Current flowed and changed over two years. “This is one of the first attempts to actually map the current where it is most active,” Jayne said.


Image
Jae-Hun Park
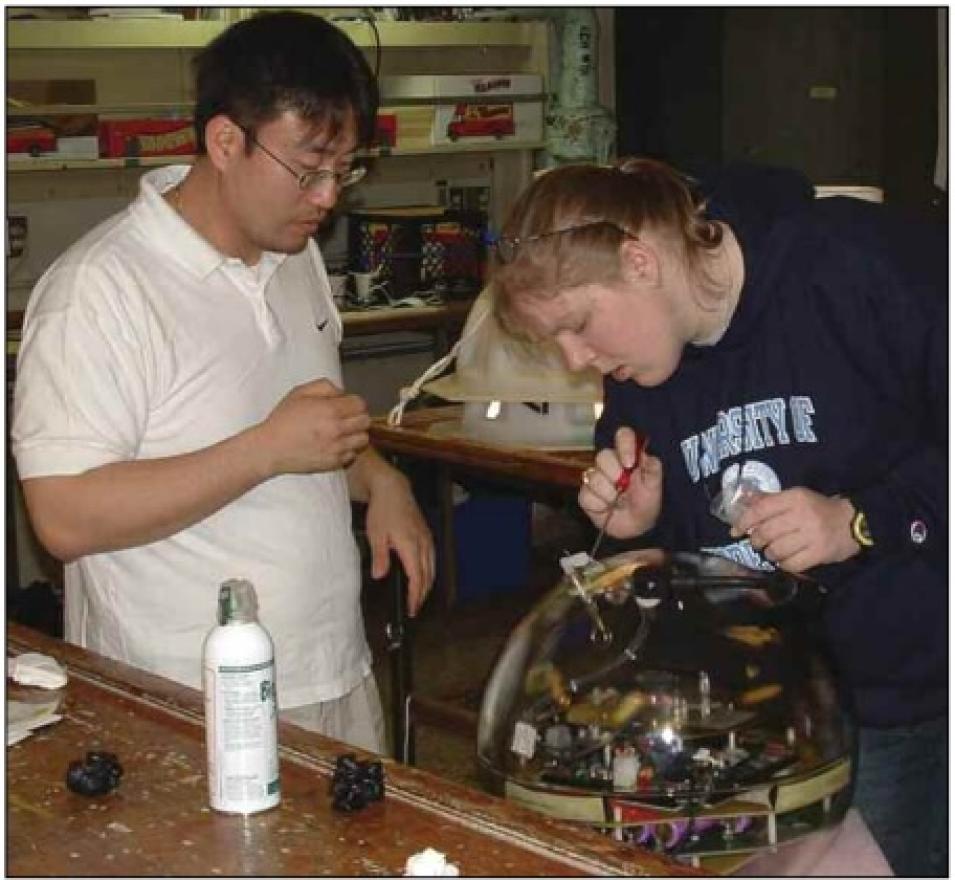
Physical oceanographer Jae-Hun Park (left) and University of Rhode Island graduate student Cristin Ashmankas (right) check an underwater sensor in the dry laboratory of the Research Vessel Thompson before it is deployed on the sea floor beneath the Kuroshio Current. (Courtesy Kuroshio Extension System Study)

KESS researchers hope their results will offer other researchers a window into the processes behind the Kuroshio and the region’s storm and climate formation. An international research initiative on ocean-atmosphere interactions, called Climate Variability and Predictability (CLIVAR), is already interested in taking the KESS results and comparing them with existing climate models. Jayne said, “The idea is to compare what we observed to numerical models and see if the models reproduce what the ocean is actually doing. It’s the equivalent of validating a forecast in the atmosphere three days out. You predict it’s going to be sunny in three days. Is it really sunny in three days?”

Ground truth

Park, also a member of the KESS group, thought that the two years of ocean bottom pressure data recorded by the sea floor sensors could help study larger questions about oceans and climate. “I realized that our data set would be excellent ground truth data for validating ocean bottom pressure measurements made by the Gravity Recovery and Climate Experiment [GRACE] twin satellites,” he said.

Ocean bottom pressure, the weight of a column of atmosphere and ocean water above a point on the sea floor, helps oceanographers predict patterns in ocean circulation and the movement of currents. Park said, “Just as meteorologists need to keep tabs on atmospheric pressure to make weather maps, oceanographers need to measure ocean bottom pressure to map out ocean circulation.”

The movement of waves and ripples on the ocean surface—minuscule changes in sea surface height—can change pressure at the bottom of the ocean. This movement of water from one area to the next, essentially a movement of mass, also affects gravity, allowing the GRACE satellites to measure changes in pressure at the bottom of the world’s oceans. Flying 300 miles above the Kuroshio, these twin satellites pass over the eddy-rich waters, responding to changes in Earth’s gravity. The lead satellite nudges towards or away from its trailing twin every time it senses a blip in the gravity field, or a mass shift from one area to the next. Surges or dips in the current can cause small variations in gravity as ocean water moves from one area to the next. When strong winds blow on the ocean surface, for example, sea surface height may go up, and the pressure at the bottom of the ocean also goes up.


Image
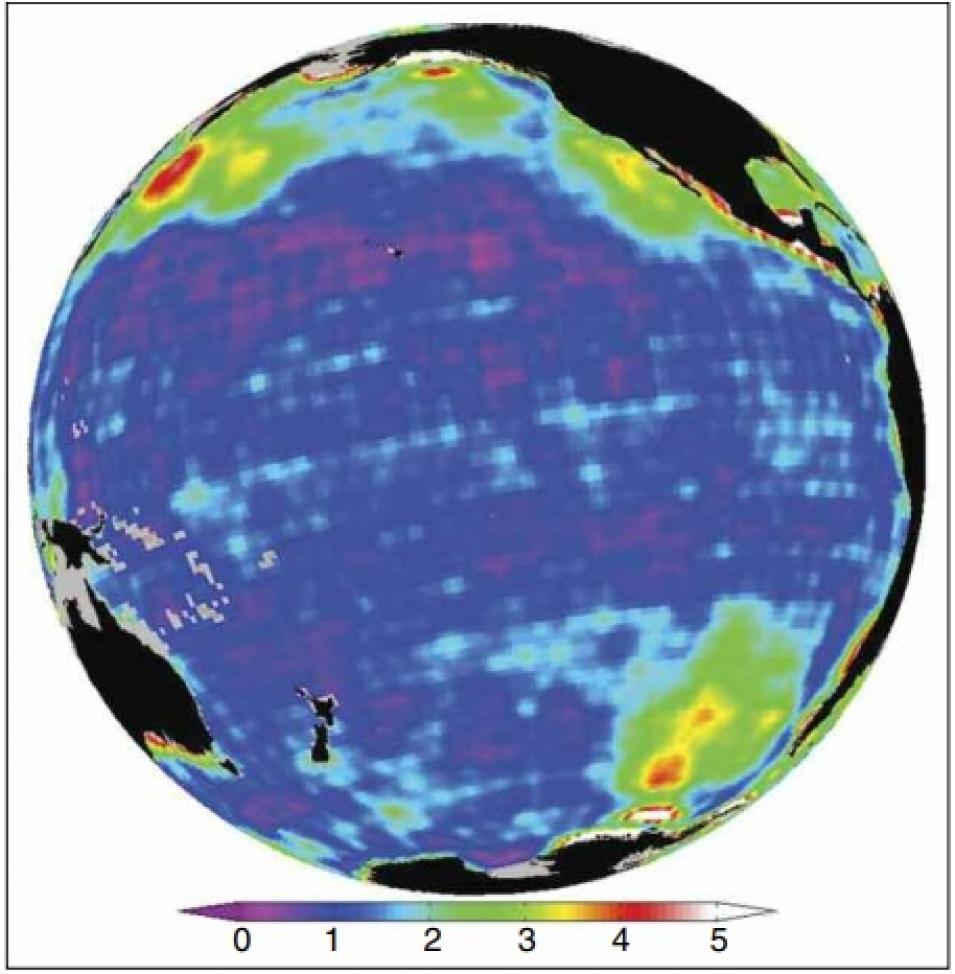
GRACE ocean bottom pressure
This map of the Pacific Ocean shows changes in ocean bottom pressure sensed by the Gravity Recovery and Climate Experiment (GRACE) satellites between 1993 and 2008. Reds and yellows show large pressure changes, and blues and purples indicate areas of little or no change. (Courtesy NASA Physical Oceanography DAAC)

The strongest weak signal

Victor Zlotnicki, an oceanographer at NASA's Jet Propulsion Laboratory, said there is good reason for Park to be validating GRACE ocean bottom pressure estimates with data from the Kuroshio Current. He said, “The Kuroshio is one of the strongest signals among weaker ocean signals, so it is a good one to study. Let’s say, for example, that it rains cats and dogs over the Amazon Region in South America, and the rain makes its way southward through the Amazon River to the Orinoco basin. That’s a huge signal—about twenty centimeters [eight inches] of water, a huge pile of water. Ocean signals, on the other hand, are the weakest. Changes in water mass in the ocean are in the order of merely two to five centimeters [one to two inches].”

Park compared the data from his array of ocean bottom pressure sensors to GRACE data from NASA's Physical Oceanography Distributed Active Archive Center (PO.DAAC). Park said, “I was pleased because the correlation between the two data sets was quite good.” The satellite had less accurate estimates for ocean features smaller than its maximum resolution of 300 kilometers (162 miles). “It can’t catch ocean features, like eddies and meanders, that are smaller than that,” Park said. “But the experiment confirms GRACE as an ideal instrument to use when looking at processes in a much bigger picture.” Zlotnicki added, “The strength of satellites is their ability to see the whole globe in days to weeks, or one month in the case of GRACE; on the other hand, most of the vast expanses of sea floor have never seen a bottom pressure recorder.”

From ocean bottom to sea surface

One such big ocean process that scientists are watching closely using GRACE is sea level rise, a gauge for how global climate is changing. “Truth is, the average bottom pressure over the world’s oceans is going up. That means the ocean is getting a little bit more water all the time,” Zlotnicki said. “Sea level is rising at about three millimeters [0.1 inch] per year. Part of that is due to the expansion of seawater because of heat. The other part is due to the addition of water from glaciers in Greenland, Antarctica, and continental regions such as Alaska.” These immense glaciers, like most of the world’s glaciers, have been shrinking because of persistent climate warming. Their meltwater flows into the ocean, causing sea level to rise.

Previously, satellite altimeters could measure changes in sea surface height, but could not distinguish between effects from heat expansion and effects from the additions of glacier melt water. However, comparing ocean bottom pressure estimates with sea surface height measurements allows researchers to single out heat-related sea level change. “GRACE is a totally new measurement,” Zlotnicki said. “We studied the world’s oceans by keeping track of sea surface temperature for the last twenty years, and we have tracked sea surface height for over fifteen years. But since 2003 we have GRACE and its measurement of the Earth’s time-varying gravity. It is changing the way we study the oceans.”

References

Jayne, S.R., N.G. Hogg, S.N. Waterman, L. Rainville, K.A. Donohue, D.R. Watts, K.L. Tracey, et al. 2009. The Kuroshio Extension and its recirculation gyres. Deep Sea Research Part I: Oceanographic Research Papers 56, doi:10.1016/j.dsr.2009.08.006.

Park, J.H., D.R. Watts, K.A. Donohue, and S.R. Jayne. 2008. A comparison of in situ bottom pressure array measurements with GRACE estimates in the Kuroshio Extension. Geophysical Research Letters 35, L17601, doi:10.1029/2008GL034778.

Song, Y.T. and V. Zlotnicki. 2004. Ocean bottom pressure waves predicted in the tropical Pacific. Geophysical Research Letters 31, L05306, doi:10.1029/2003GL018980.

For more information

NASA Physical Oceanography Distributed Active Archive Center (PO.DAAC)

Gravity Recovery and Climate Experiment (GRACE)

Kuroshio Extension System Study

About the remote sensing data
Satellite Gravity Recovery and Climate Experiment (GRACE)
Sensor K-Band Ranging System (KBR)
Data set GRACE Mass Grids
Resolution 1 degree
Parameter Ocean bottom pressure
DAAC NASA Physical Oceanography Distributed Active Archive Center (PO.DAAC)
Last Updated