Out of Africa

Researchers revise the story behind Puerto Rico’s 2015 drought.
author-share

When Puerto Rico initiated water rations in May 2015, its residents got creative. Children bathed in buckets. Families captured the initial cold water in their showers to fill toilet tanks, where they would then wash their hands on the days the water utility turned off the tap. Depending on where you lived, water was turned off for 24 or 48 hours and then back on for 24 hours. Pitchers, cisterns, and other plastic containers cluttered homes, yards, even rooftops to compensate for those dry tap days.

Most major national and international media outlets blamed the 2015 drought on El Niño, the warm phase of a weather oscillation often associated with drought. The Puerto Rican National Weather Service, however, kept discussing the role of the Saharan Air Layer (SAL) in their daily forecasts. This piqued Thomas Mote, a climate scientist from the University of Georgia, because El Niño did not seem like a reasonable explanation.

The drought really hit eastern Puerto Rico and the early rain season, affecting April, May, and June. If El Niño interferes with weather, which it rarely does in the eastern Caribbean, it would do so during the hurricane season in late summer and into fall. To weed out the culprit behind the 2015 drought, Mote needed to model the weather patterns around Puerto Rico. The challenge, however, was that most precipitation models are geared for the mid latitudes, where the mechanisms driving weather are fundamentally different from the tropics. So Mote and his team needed to find a tool that could measure thunderstorm potential specifically for the tropics. Then they could consider if the SAL played a significant part in the drought.
Image
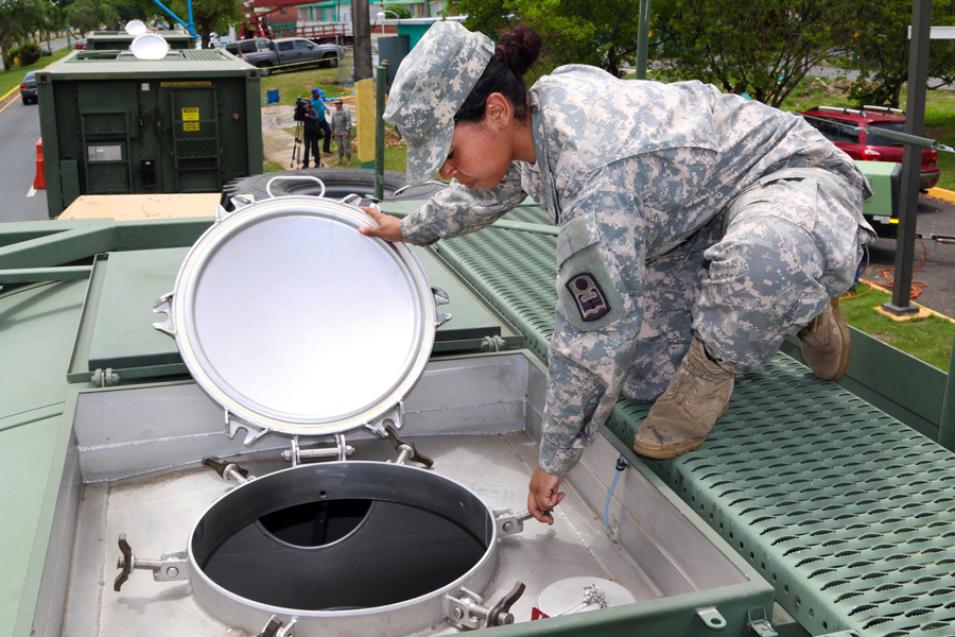
A National Guard member opens a portable military water tank, which is used to distribute potable water to communities affected by the 2015 drought. (Courtesy thenationalguard/Flickr)

Current disasters

It had been 20 years since a drought hit Puerto Rico, but 2015 was extreme - a category the US Drought Monitor defines as having major crop and pasture losses and widespread water shortages. At its peak in August, 74 of its 77 municipalities rationed water. Losing paying customers cost the Puerto Rico Aqueduct and Sewer Authority $15 million a month.

For an island already hardened by economic struggles, and $73 billion in debt, Puerto Rico faced record-low rainfall and crumbling water infrastructure: dams in disrepair, silt-blocked reservoirs, and leaky pipelines that lost more than half of the water they transported. Many of these US citizens not only blamed nature, but also politics for the despairing situation. In terms of low rainfall, however, local meteorologists got it right.

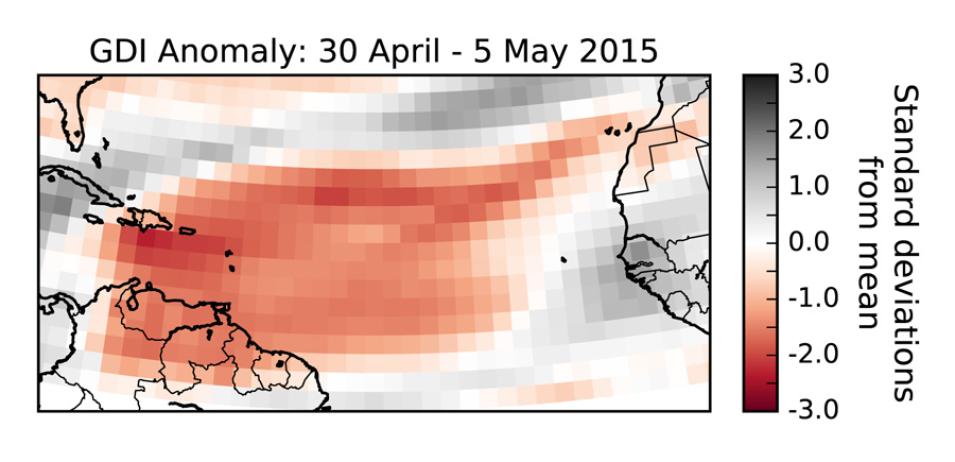
When summarizing daily climate drivers for their forecast, Puerto Rican meteorologists often mentioned the SAL. Mote noted their use of the Gálvez-Davison Index (GDI), an experimental tool designed by the Weather Prediction Center, part of the National Oceanic and Atmospheric Administration (NOAA), to better forecast precipitation in the tropics and Caribbean. This index estimates convection, or the likelihood of a thunderstorm brewing in the tropics. Craig Ramseyer, a professor at Salisbury University in Maryland, calculated the prospect for rain using the GDI for April, May, and June of 2015, when the atmosphere should be volatile enough for rain to form. Instead, it was quite stable. “What was interesting about it was when we visualized the convective signal, it had a very coherent pathway back to Africa,” Ramseyer said. “And we were like, ‘Wow, that should be associated with the Saharan Air Layer.’”

The SAL is an extremely hot, dry swath of dust streaming along in the upper atmosphere. “It’s kind of like a fire hose that’s getting sprayed out of Saharan Africa and into the eastern Caribbean,” Ramseyer said. It often glides a few kilometers above the Atlantic Ocean on top of more humid air. The atmosphere, like the ocean, is composed of currents. Moist currents must rise easily and rapidly for thunderstorm formation. But in the Caribbean and tropics at large, another key component for rain is a temperature phenomenon called the trade wind inversion, basically a lid of warm air. “I like to visualize the inversion as depth,” Ramseyer said. A strong, deep lid prevents upward mobility and no thunderstorms will form. Mote said, “Normally, the inversion layer is weak enough that thunderstorms can build through the warmth and continue to develop through it.”

Image
La Perla, the poorest neighborhood in San Juan, Puerto Rico, pops with color. The drought mainly affected the eastern, more populated portion, including San Juan, burdening the lives of 2.5 million of Puerto Rico’s 3.5 million population. (Courtesy khowaga/Flickr)

Root origins

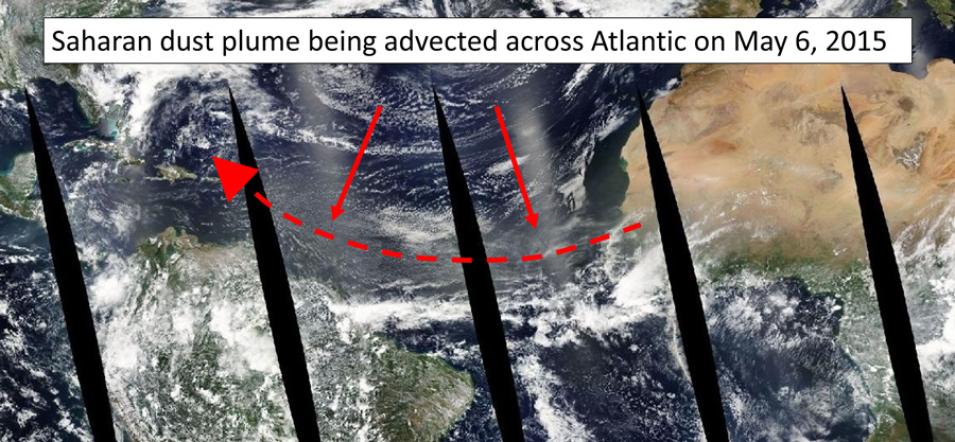
In the spring of 2015, the sky over San Juan - Puerto Rico’s capital - turned hazy. It looked like smog, but residents were familiar with the dust coming out of Africa. The Sahara Desert is Earth’s largest desert, almost the size of the continental United States. Each year rising dust forms massive plumes visible from space, though dust particles themselves are tiny - no more than a tenth of the width of a human hair.

The SAL rides right along the trade wind inversion. The GDI measures the magnitude of the trade wind inversion - deeper inversions hint that the SAL is more active. “It is not a definitive causality but it certainly suggests the SAL is at play,” Ramseyer said. Prior to the development of the GDI, climate indexes signaled rain, but no actual thunderstorms would form. “The environment and the atmosphere have sort of different ingredients needed in the tropics versus the mid latitudes,” Ramseyer said. “In the middle latitudes, for example, what’s happening up at about 30,000 to 40,000 feet is very important in thunderstorm formation; in the tropics, we don’t need that.” So models of the tropics could not properly incorporate the SAL.

To get to the root of the 2015 drought, Mote’s team first detected if and when the inversion was getting stronger. If it was, then they needed observations from the Ozone Monitoring Instrument (OMI) on the NASA Aura satellite, and specifically its Aerosol Index (AI) data, to find dust was present in the atmosphere. NASA's Goddard Earth Sciences Data and Information Services Center (GES DISC) stores AI data, which measures minuscule atmospheric particles by calculating the difference between the amount of ultraviolet light scattering in a dust-filled and non-dust-filled atmosphere. But what degree of dust was out of the ordinary?

“April, May, and June typically have lots of dust in the atmosphere, so we needed to see if the Saharan Air Layer made any difference,” Ramseyer said. To compare, he first needed to know what was normal for early spring in Puerto Rico. The team went back as far as the satellite data could take them—to the early 2000s—determining average dust levels for aerosols in the sky for every day in spring.

Image
This image shows a true color composite of a Saharan dust plum crossing the Atlantic Ocean on May 6, 2015. Data are from the Moderate Resolution Imaging Spectroradiometer (MODIS) sensor on the NASA Terra satellite. (Courtesy NASA)

The a-ha moment

After establishing a baseline for spring conditions, the team found that dust levels in 2015 were 50 percent higher than normal for April, May, and June. “I was surprised to see such a robust signal,” Mote said. That extra dust absorbs solar radiation in the atmosphere, warming the trade wind inversion further, and capping the rise of moisture needed for thunderstorm formation. The tropics have a dry season, typically winter in the Northern Hemisphere, and a wet season in early spring and late summer or early fall, corresponding with the hurricane season. “What was unique about 2015, and we think other years where we see a drop in the early rainfall season, is that the SAL comes across the Atlantic sooner than normal,” Mote said.

The researchers cannot yet say why the SAL arrived earlier than usual in 2015 or other early season drought years, but think this would be a fruitful area of scholarship. “Good aerosol data are still fairly limited,” Mote said. “We can’t go back and recreate what we didn’t have, so we look forward to the time when we’ll have even longer records of ground- and satellite-based products of aerosols.” As for Ramseyer, he was surprised by how little awareness exists among a lot of research bodies about the importance of the SAL in the eastern Caribbean. “Sometimes climatologists, in particular, fall back on the El Niño stuff. And for us to be able to tell them about the SAL being a key piece was kind of an a-ha moment.”

Image

For more information

NASA Goddard Earth Sciences Data and Information Services Center (GES DISC)

NASA Oak Ridge National Laboratory Distributed Active Archive Center (ORNL DAAC)

Daymet

NASA Ozone Monitoring Instrument (OMI)

References

Hovila, J., A. Arola, and J. Tamminen. 2007. OMI/Aura Surface UV Irradiance 1-orbit L2 Swath 13x24 km V003, Greenbelt, MD, USA, Goddard Earth Sciences Data and Information Services Center (GES DISC). doi:10.5067/Aura/OMI/DATA2027.

Mote, T. L., C. A. Ramseyer, and P. W. Miller. 2017. The Saharan Air Layer as an early rainfall season suppressant in the eastern Caribbean: The 2015 Puerto Rico drought. Journal of Geophysical Research: Atmospheres, 122: 10,966-10,982. doi:10.1002/2017JD026911.

NOAA Weather Prediction Center. 2016. Experimental Gálvez-Davison Index (GDI), accessed 2 April 2017. http://www.wpc.ncep.noaa.gov/international/gdi

Ramseyer, C. A. and T. L. Mote. 2016: Atmospheric controls on Puerto Rico precipitation using artificial neural networks. Climate Dynamics 47: 2,515-2,526. doi:10.1007/s00382-016-2980-3.

Thornton, P.E., M. M. Thornton, B. W. Mayer, Y. Wei, R. Devarakonda, R. S. Vose, and R. B. Cook. 2018. Daymet: Daily Surface Weather Data on a 1-km Grid for North America, Version 3. ORNL DAAC, Oak Ridge, TN, USA. doi:10.3334/ORNLDAAC/1328.

About the remote sensing data
Satellite Aura  
Sensors Ozone Monitoring Index Various meteorological sensors
Data sets OMUVB: OMI/Aura Surface UV Irradiance 1-orbit L2 Swath 13 x 24 km V003 Daymet v3
Resolution 13 x 24 kilometer 1 x 1 kilometer
Parameters Irradiance Temperature, precipitation occurrence and amount, humidity, shortwave radiation, snow water equivalent, and day length
DAACs NASA Goddard Earth Sciences Data and Information Services Center (GES DISC) NASA Oak Ridge National Laboratory Distributed Active Archive Center (ORNL DAAC)
Last Updated