Measure for Measure
Based on a 2001 study, the Intergovernmental Panel on Climate Change (IPCC) predicts that global mean sea level may rise as much as 88 cm (approximately 35 inches) by the end of the 21st century. Scientists estimate that during the 20th century, global mean sea level rose between 10 and 25 cm (4 and 10 inches), on average. Potentially, sea level rise will have the greatest impacts on large, populous low-lying coastal cities, however few countries have planned ways to deal with rising sea levels.
"In my experience, only Britain, Japan, Germany and the Netherlands have started really thinking about what climate change means with regard to long-term coastal use," said Robert Nicholls, a professor and scientist at Middlesex University's Flood Hazard Research Centre in Britain. "In all four countries, decisions are made differently now that people have thought about climate change. For example, sea walls are built higher and some areas threatened by flooding are deemed not worth protecting."
Nations have developed a variety of responses to such hazards. Countries, such as Japan and the Netherlands, rely on dikes or protective sand dunes to keep flooding problems at bay. Other regions have adapted to such hazards. For example, in some regions of the United States, East Coast oceanfront houses are built on pilings and vegetation planted in coastal flood plains is salt tolerant. A third strategy prohibits or restricts building in frequently flooded coastal zones. In general, an individual country's response to sea level rise depends on its wealth, population, culture, and politics.
Sea level rise exacerbates beach erosion and increases salinization in regions where saltwater invades upriver from coasts. Coastal wetlands, which often mitigate flooding effects, migrate over time but will disappear in areas where low-lying coastal uplands either do not exist or are protected by structures such as seawalls. With rising oceans, flooding of rivers near coasts increases when rivers are unable to flow effectively to sea and back up. Because of this "backwater effect," deltaic areas such as Bangladesh may suffer severe flooding in the event of sea level rise, Nicholls said.
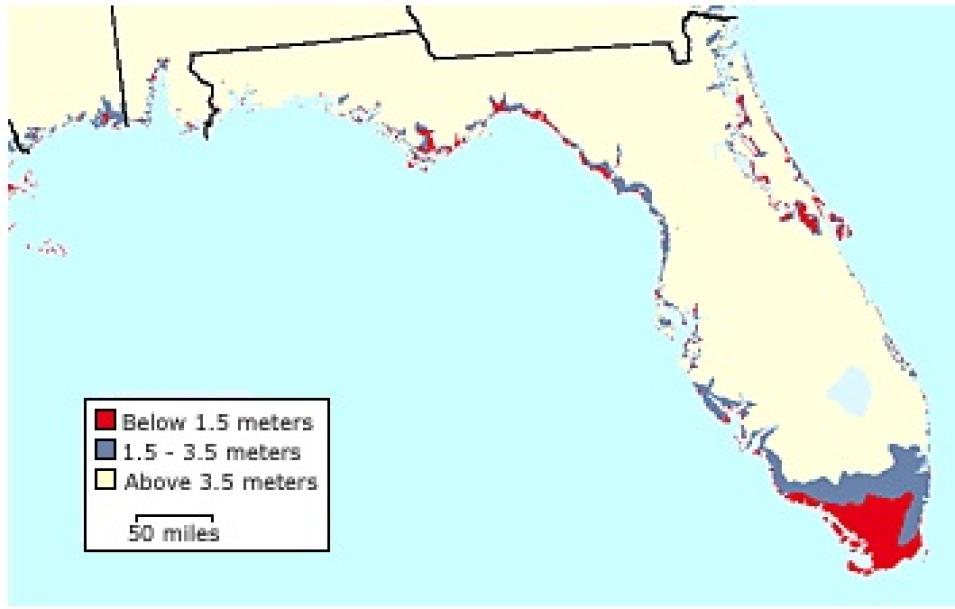
This map illustrates land in Florida within 1.5 and 3.5 meters of the National Geodetic Vertical Datum of 1929, a benchmark that was roughly mean sea level in the year 1929 but approximately 20 cm below today's sea level. It is based on modeled elevations, not actual surveys. (Images courtesy of the EPA Publications: Maps of Lands Vulnerable to Sea Level Rise).
Sea level rise occurs as seawater volumes expand due to increasing sea surface temperatures. A secondary, and probably smaller, contributor to sea level rise results from melting of the world's glaciers.
Faced with predictions of ever increasing urban coastal population over time, governments and policy planners have begun turning to scientists to better understand the susceptibility of coastal cities and nations under climate warming scenarios.
Funded by the European Union, scientists on the Dynamic and Interactive Assessment of National, Regional and Global Vulnerability of Coastal Zones to Climate Change and Sea-Level Rise (DINAS-COAST) project are working to create software to help policy makers better understand coastal vulnerability to sea-level rise under a variety of climate and socioeconomic scenarios.
Nicholls, one of the scientists working on the DINAS-COAST project, will use Gridded Population of the World (GPW) data from NASA's Socioeconomic Data and Applications Center (SEDAC) at Columbia University to better estimate the impact of sea level rise on coastal populations at global and regional scales.
Nicholls first used the GPW data while he was a Senior Visiting Scientist at Columbia University's Lamont Doherty Earth Observatory earlier this year. In an unpublished study, he and Chris Small paired population data with a digital elevation model to obtain better estimates of the world's coastal population density. They estimated that coastal populations amounted to 23 percent of the world's population in 1990, much less than the frequently quoted 50 to 60 percent.
"The DINAS-COAST model will use the GPW data to predict global population density. We'll reprocess the data on a larger scale that will allow scientists and planners to see how sea level rise might impact coastal populations over regions such as the Mediterranean or Europe as a whole," said Nicholls.
DINAS-COAST will allow policy makers and government officials to simulate climate change and sea level rise scenarios, helping them set priorities and evaluate responses to coastal zone changes in urban areas around the world. A range of users are expected, including those engaged in discussions of greenhouse gas emissions within the United Nations Framework Convention on Climate Change, which includes the Kyoto Protocol.
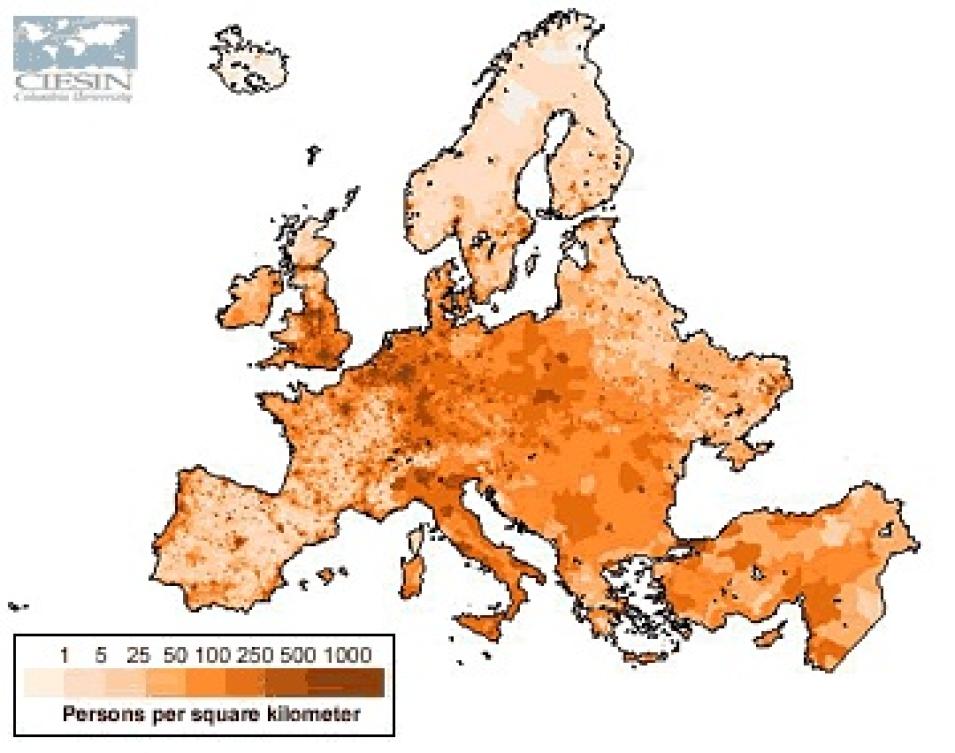
This map shows the population density in Europe in 1995. (Image courtesy of the Socioeconomic Data and Applications Center).
"Just by using the global population data with existing sea level models, DINAS-COAST will improve our predictions regarding changing sea level," Nicholls said. "In practical terms, the way that governments deal with sea level rise varies from place to place. It's not possible to predict the future but with models such as DINAS-COAST we can help people see what futures might exist and steer them towards the ones that look best."
References
IPCC Third Assessment Report: Climate Change. 2001. https://archive.ipcc.ch/publications_and_data/publications_and_data_reports.shtml#1 Accessed August 17, 2001.
Houghton, J.T., L.G. Meira Filho, B.A. Callander, N. Harris, A. Kattenberg, and K. Maskell (eds). 1996. Climate Change 1995: The Science of Climate Change. Contribution from the Working Group I to the Second Assessment Report of the Intergovernmental Panel on Climate Change. Cambridge University Press.
For more information
NASA Socioeconomic Data and Applications Center (SEDAC)
| About the data used | ||
|---|---|---|
| Data | Gridded Population of the World (GPW) Multi-angle Imaging SpectroRadiometer (MISR) Digital Elevation Model (DEM) | |
| Parameter | coastal populations and sea level rise | |
| DAAC | NASA Socioeconomic Data and Applications Center (SEDAC) | |


