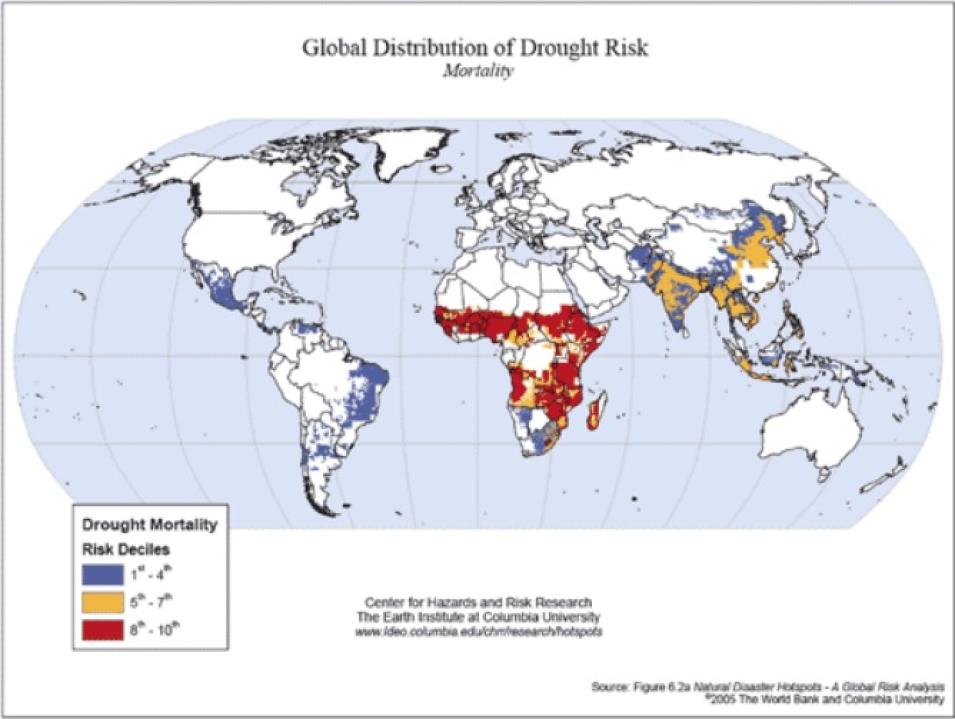
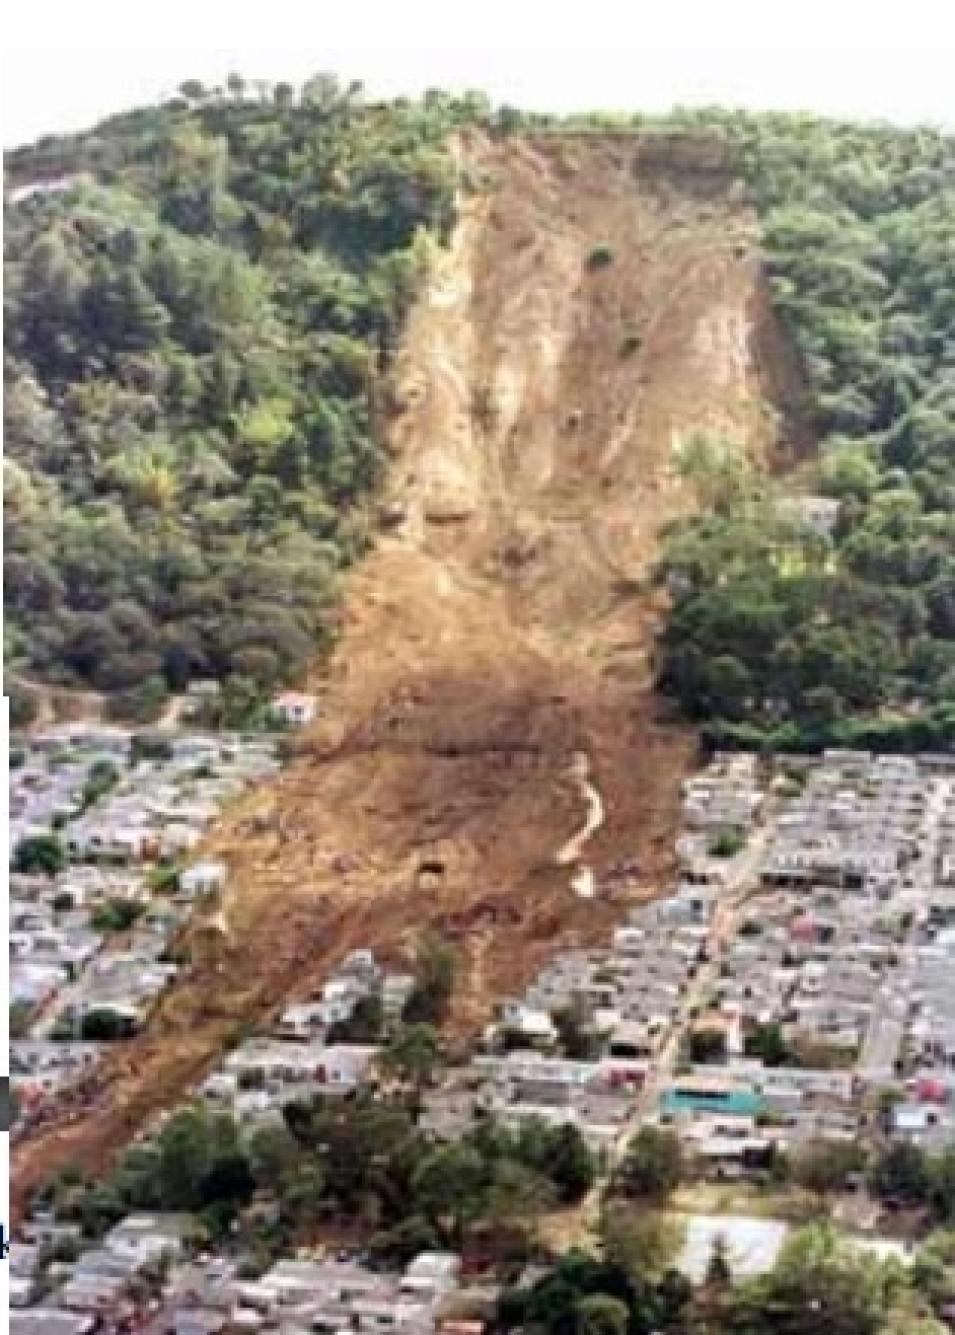
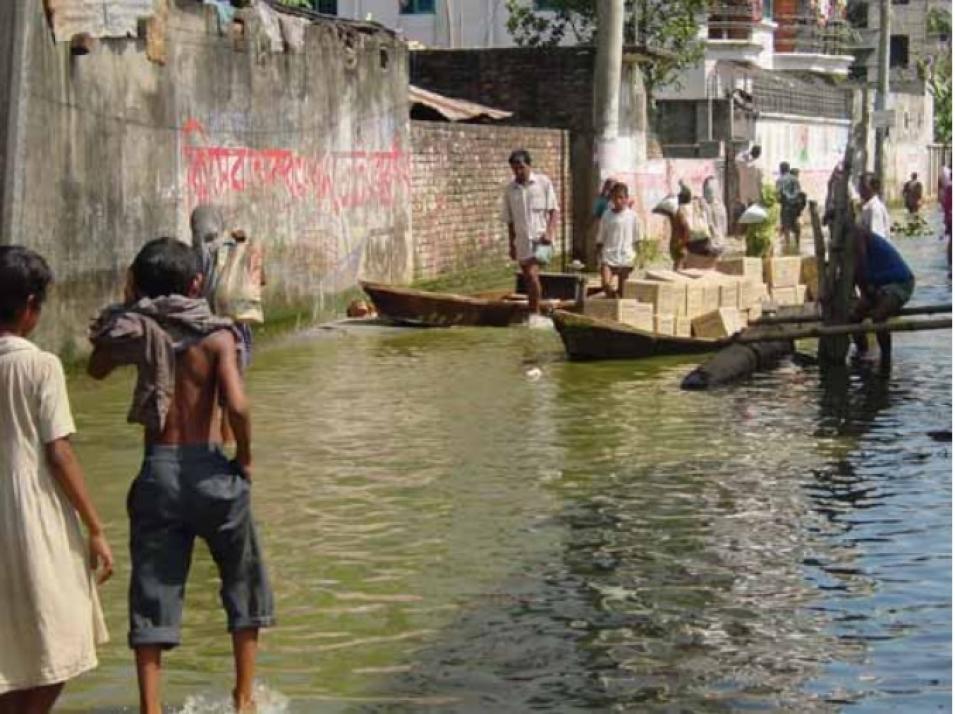
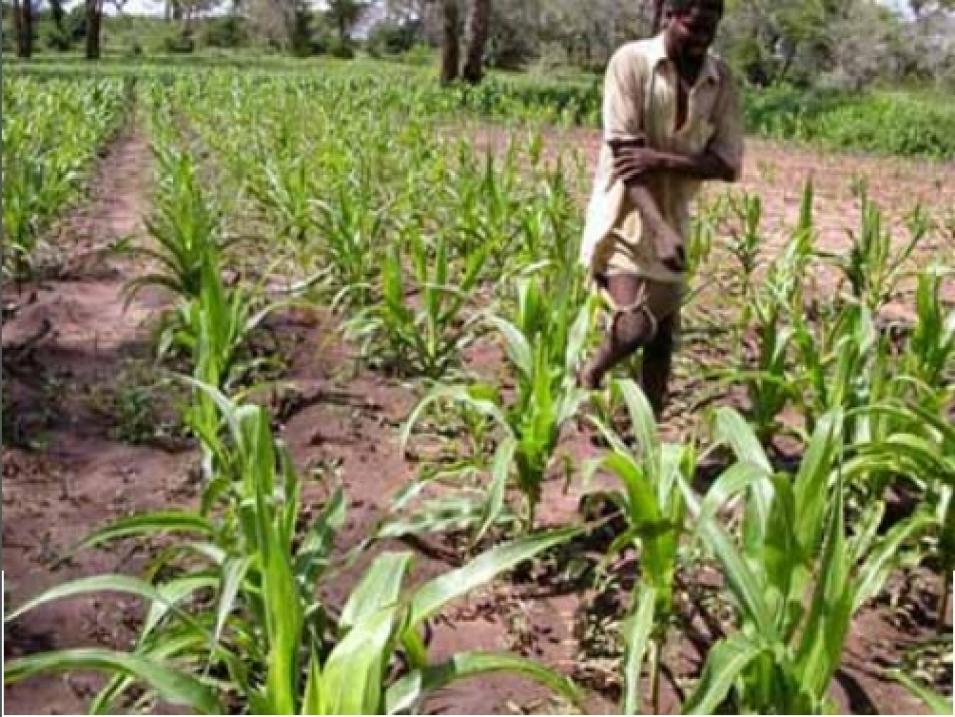
When buying a new house, most people probably would not choose to live in an earthquake-prone, routinely flooded area subject to landslides and cyclones. Yet in places around the world, such as the Philippines and parts of Central America, nearly everyone considers such an area their home. To help predict, mitigate, and plan for disasters, scientists have developed a global analysis of where natural disasters occur, quantifying their human and financial impacts and identifying areas around the world with the highest natural disaster risk.
Scientist Maxx Dilley took part in a mission to develop a global picture of natural disaster risk. Dilley said, "We wanted to produce an analysis of the places in the world where disasters were most likely to occur, as well as why disasters were more likely in those places." Dilley, who now specializes in disaster and risk assessment as a policy advisor with the United Nations Development Program (UNDP) Disaster Prevention Unit, was then on a team at Columbia University, led by Robert Chen, Manager of NASA's Socioeconomic Data and Applications Center (SEDAC), and Art Lerner-Lam, Director of the Center for Hazards and Risk Research, that collaborated with The World Bank and the ProVention Consortium on this goal. The resulting report, Natural Disaster Hotspots: A Global Risk Analysis, and the accompanying data set, synthesized historical data on six major natural hazards —cyclones, drought, earthquakes, floods, landslides, and volcanoes—as well as population, economic, and hazard-related mortality information. The "Hotspots" report provides the first integrated global picture of natural hazards and their impacts around the world.
The team combined population data, provided by SEDAC, with gross domestic product (GDP) and other socioeconomic data to provide the global basis for quantifying risk. Because these data were gridded, Dilley and his colleagues could break down risk by grid cells, enabling them to analyze risk at subnational and regional levels. After masking out sparsely populated cells, they could focus on areas where natural disasters would have the greatest impact. Their analysis rated each of the remaining grid cells according to historical losses incurred from each of the six hazards, and then classified each cell's level of risk. For instance, a cell with high population that has been exposed to no hazards is rated as relatively low risk, but a cell with high concentrations of population or GDP that has been exposed to multiple hazards is rated as a hotspot.
Analyzing disaster risk in terms of grid cells also allowed their study to transcend geopolitical borders. "We get a finer sense of the risk by looking at these relatively small grid cells than we do when we're dealing with countries as the unit of analysis," said Dilley. "We start seeing regions of risk that are dictated by fault lines and tectonic plate boundaries and climatic systems that span across national boundaries."
