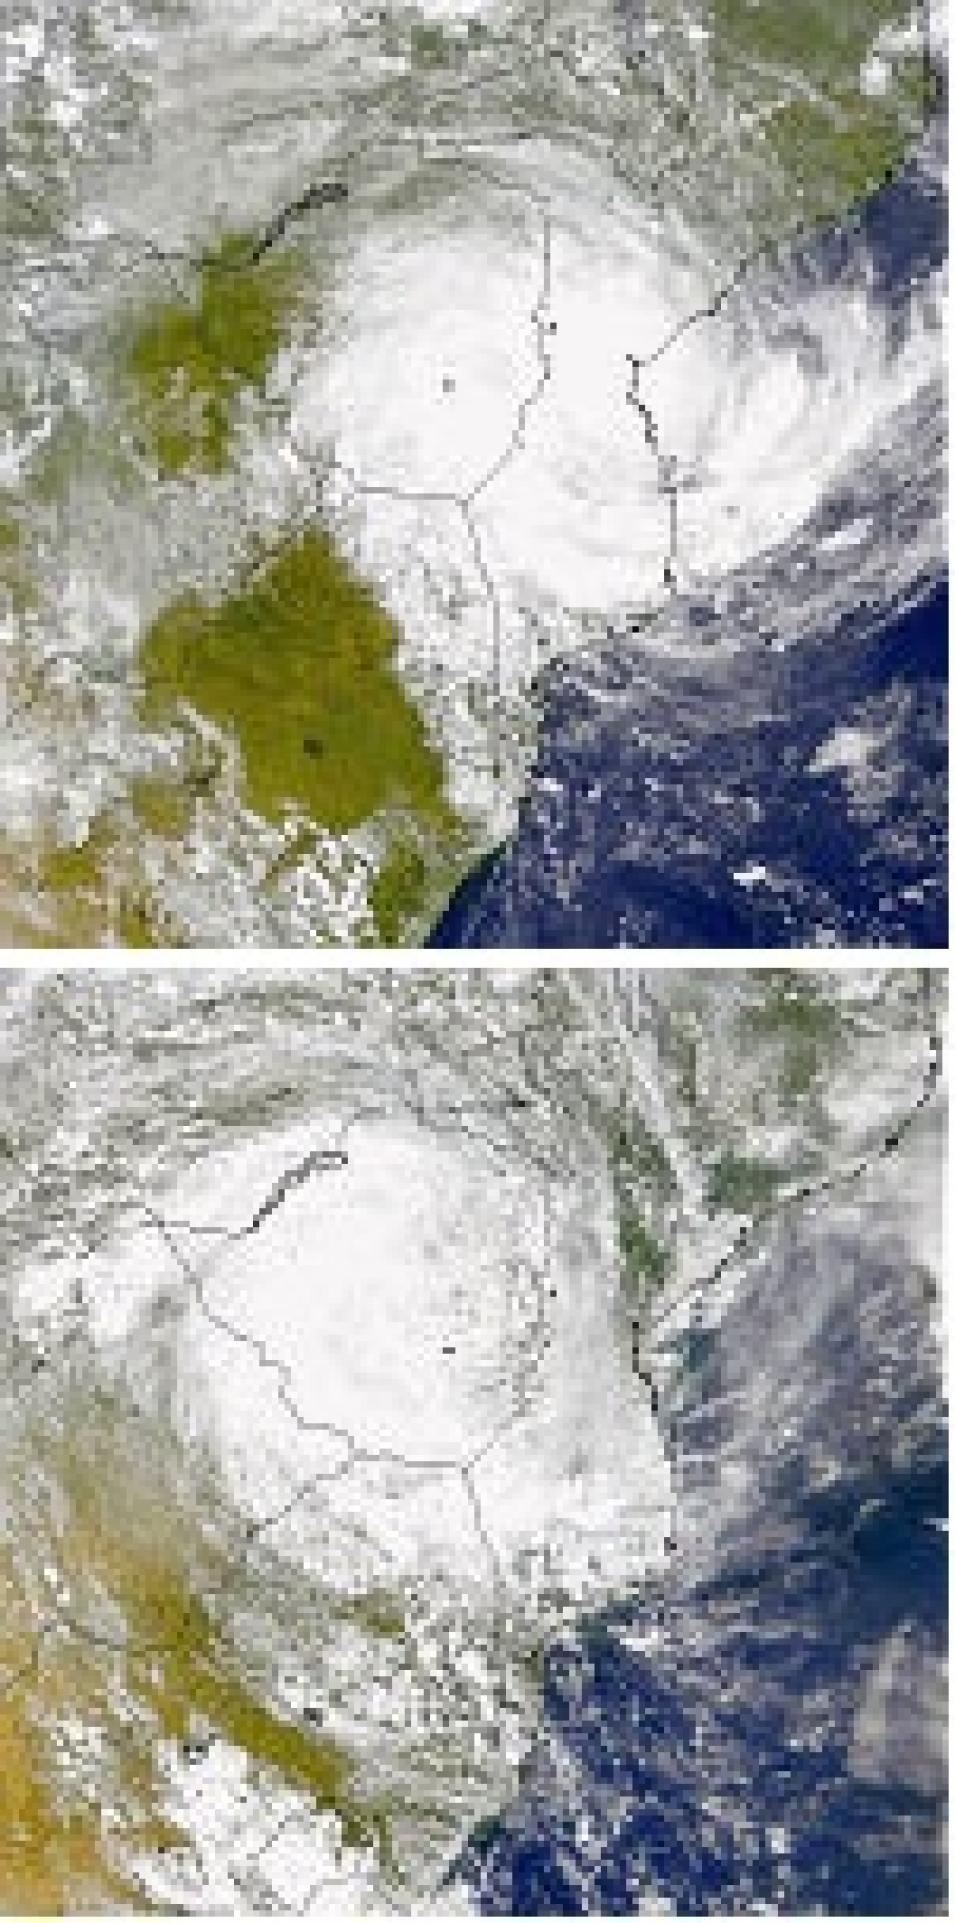
In February 2000, Cyclone Eline slammed into the southeast African coastal nation of Mozambique, washing away an entire fishing village and leaving some 800,000 people dead or homeless. According to news reports, weeks of flooding had already displaced more than 200,000 residents even before the storm made landfall.
Forecasting Fury
Cyclone Eline makes landfall on 22 February 2000 (above), and 23 February 2000 (below). (Images courtesy of the SeaWiFS Project).
Less than a year later, Typhoon Xangsane produced the worst flooding in Taiwan in 30 years, killing 51 Taiwanese people and 23 crew members who perished when their Panamanian cargo ship sank in the Pacific Ocean.
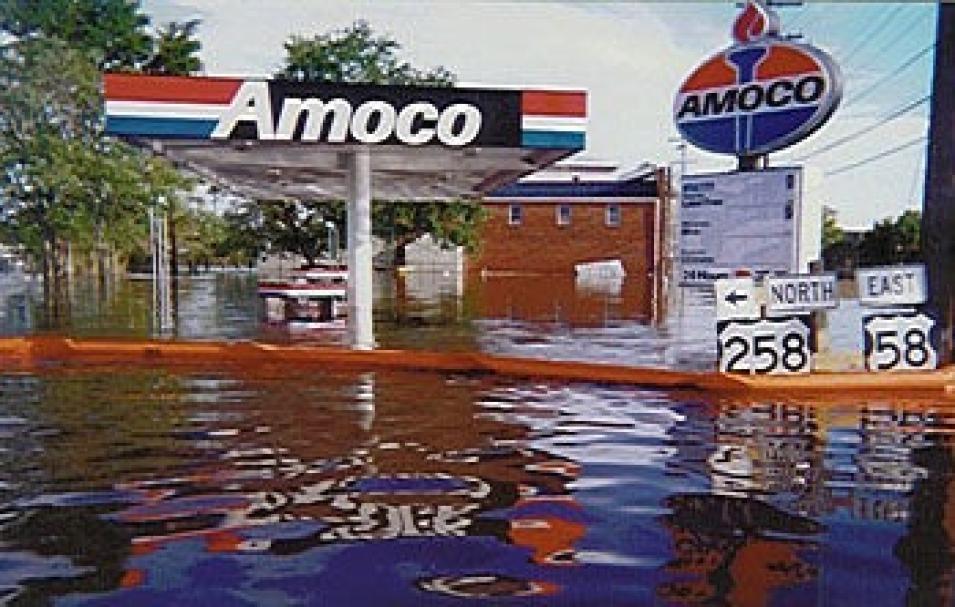
In the Atlantic, 1999 marked the most active hurricane season on record. Twelve major tropical storms occurred, including five Category IV hurricanes, the most ever recorded for one year. Hurricane Floyd, the most destructive storm of the season, left 6,000 North Carolina residents homeless and cost insurers $1.8 billion for property damage to over 12,000 homes.
Experts at Colorado State University and the National Hurricane Center predict a period of elevated storm activity during the next 15 years. Along with a recent population boom along the U.S. Gulf and Atlantic coasts, this heightened threat of hurricanes means increasing threats to life and property. But data from a NASA satellite instrument could allow researchers to detect potential hurricanes up to two days earlier than with traditional forecasting methods.
A tropical cyclone is an area of low pressure over warm tropical or subtropical waters that displays an organized pattern of convection and a definite pattern of surface wind circulation. The terms "hurricane" and "typhoon" are regionally specific names that generally refer to a severe tropical cyclone. Tropical cyclones with maximum sustained surface winds of less than 38 miles per hour are called "tropical depressions." Once a tropical depression sustains winds of at least 39 miles per hour, it is typically upgraded to a "tropical storm" and assigned a name. Hurricanes are intense storm systems, sustaining winds of 74 miles per hour or higher.
Once a hurricane makes landfall, it produces torrential rain and flooding and often spawns tornadoes. Each year, an average of 10 tropical storms, six of which become hurricanes, develop over the Atlantic Ocean, Caribbean Sea, or Gulf of Mexico. While many of these remain over the ocean, about five hurricanes strike the United States coastline every three years.
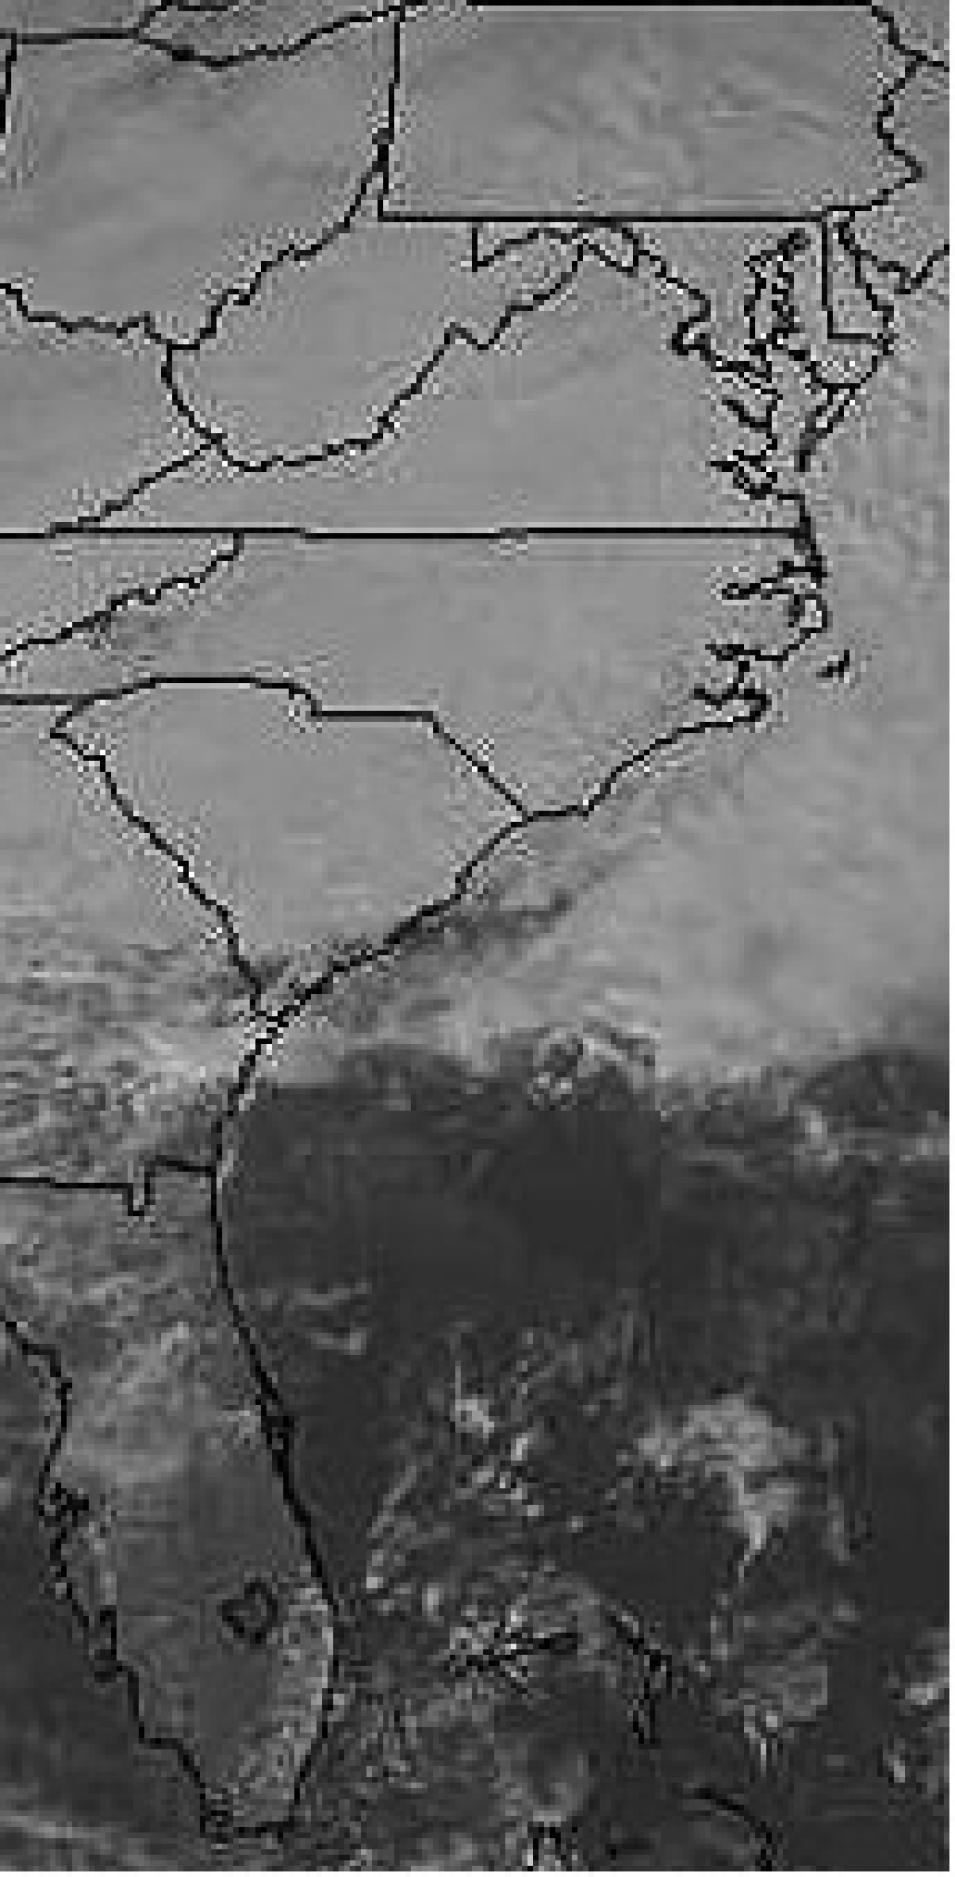
Traditionally, forecasters identified these storm systems by examining cloud top imagery from weather satellites, such as NASA's Geostationary Operational Environmental Satellite (GOES), to detect the presence of convective cloud rotation. But heavy cloud cover can obscure surface features, such as the circular wind rotation that often amplifies into a hurricane.
"If dense cloud cover is present in the upper atmosphere, geostationary satellites can't detect rotation in the lower atmosphere," said Evan B. Forde, oceanographer at NOAA's Atlantic Oceanographic and Meteorological Laboratory (AOML) in Miami, Florida. "It's a hit-or-miss situation — some days you might see what's beneath the clouds, but a lot of the time you won't."
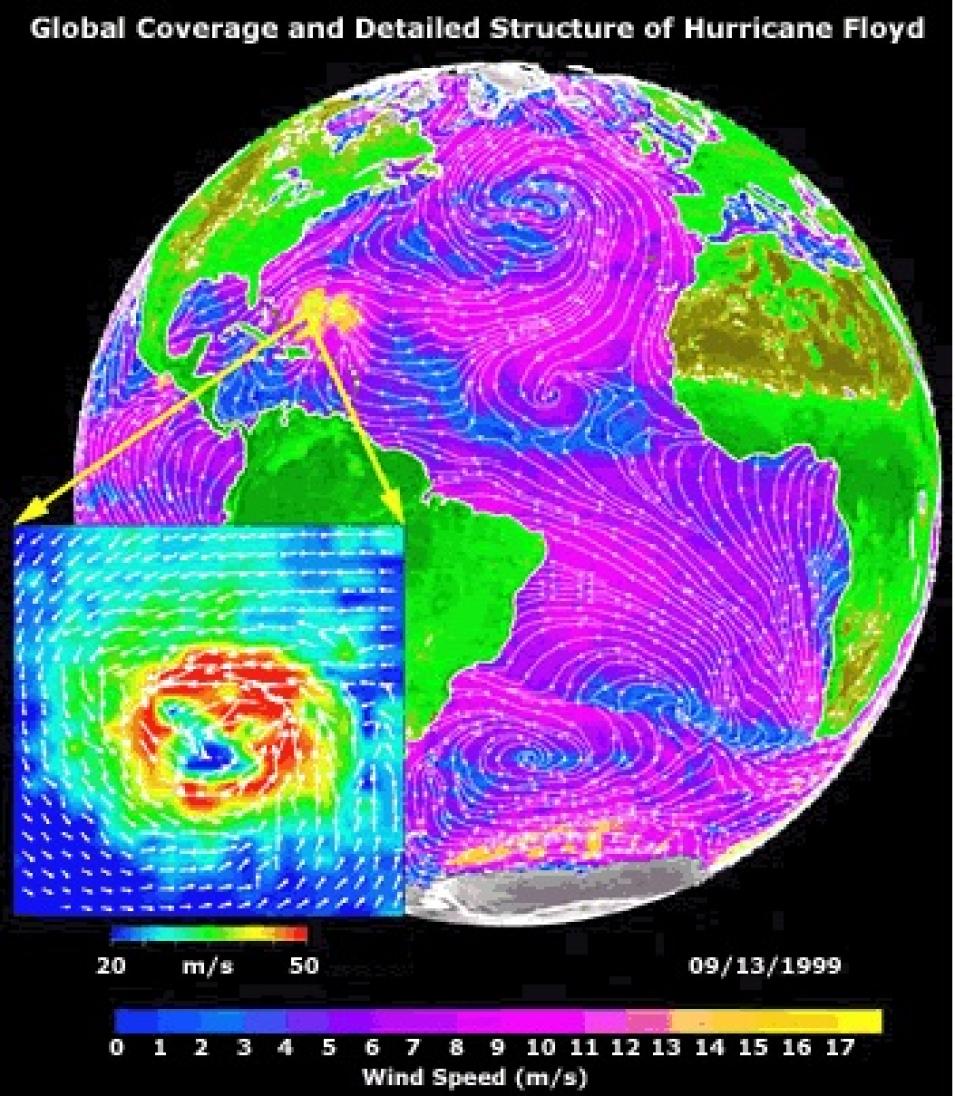
SeaWinds is a scatterometer that measures near-surface wind speed and direction at the Earth's surface under all weather and cloud conditions. Launched aboard NASA's QuikSCAT satellite in 1999 as part of the Earth Observing System (EOS) program, the instrument was designed to detect short wavelengths, which enables it to penetrate, or "look through," the cloud cover to the ocean surface.
This GOES image of the U.S. East Coast was taken on February 22, 2001. Heavy cloud cover can obscure surface features such as circular wind rotation.
The SeaWinds/QuikSCAT project is managed for NASA's Earth Science Enterprise by the Jet Propulsion Laboratory (JPL), a division of the California Institute of Technology.
SeaWinds data products are distributed through NASA's Physical Oceanography Distributed Active Archive Center (PO.DAAC).
Scatterometers work by sending a beam of microwave radiation, which passes through cloud cover, to the Earth's surface. When the microwave pulses hit the ocean surface, a scattering effect, known as a backscatter, is produced. A rough ocean surface returns a stronger signal, as the turbulent waves reflect more radar energy back to the scatterometer's antenna, while a smooth ocean surface returns a weaker signal.
Ocean scatterometers play an increasingly important role in oceanographic, meteorological, and climate studies, providing scientists with data vital to studying the effects of air-sea interactions on global weather patterns. While other radar-based satellites can measure wind speed, only the scatterometer can measure the wind vector, or the speed and direction together.
Unlike most previous spaceborne scatterometers, which can only capture about 250 miles of the Earth's surface in one pass, SeaWinds has an 1,800-kilometer-wide (1,116-mile-wide) swath that covers 90 percent of the Earth's ice-free oceans every day. This sweeping coverage provides scientists with one large picture of a storm, rather than individual snapshots that have to be pieced together.
For example, in a study of the 1999 hurricane season, Forde's research team compared SeaWinds data with data from the European Remote-Sensing Satellite-2 (ERS-2). "ERS-2 caught one section of Hurricane Floyd on three or four passes, whereas SeaWinds provided coverage of the entire storm in one pass," he said.
In their NASA-supported study, led by AOML Director Kristina Katsaros, Forde and colleagues examined SeaWinds data collected during the 1999 hurricane season (August to November) in the tropical Atlantic, Caribbean, and Gulf of Mexico. "We wanted to determine when we could first see these tropical depressions using SeaWinds data, as opposed to when we could first see them with imagery from the geostationary satellites," said Forde.
First, the researchers noted the date and time that each storm system was classified as a tropical depression by the National Hurricane Center (NHC). Next, they looked at SeaWinds data collected 12 to 48 hours prior to the NHC designation time to see when they could first detect the presence of closed circulation, which typically characterizes a developing tropical cyclone.
"We focused on when we could first see the rotation on more than one QuikSCAT pass," said Forde. "Sometimes you see systems that have closed surface circulation, but 12 hours later on the next QuikSCAT pass, you don't see anything."
In most cases, the team detected the closed wind circulation well before it could be seen as cloud swirls on GOES satellite images. The lead times ranged from a few hours for Hurricane Irene to 49 hours for Hurricane Floyd.
Early detection is essential to weather forecasters, who are charged with issuing advisories and warnings for storms over large expanses of ocean. Due to the potentially large margin of error associated with hurricane landfall predictions, hurricane warnings issued by the National Weather Service are necessarily conservative and may typically include an area of coastal region somewhat larger than the area where the storm will actually make landfall. This means that thousands of people are often evacuated from regions that ultimately suffer little damage.
Advance warning is particularly important in the Gulf of Mexico and in remote regions of the Pacific and Indian Oceans, where storm systems often develop rapidly and make landfall in a relatively short period of time. "A day or two additional notice can make a huge difference when you're trying to evacuate people and protect property," said Forde.
Earlier detection also enables more efficient use of NHC resources. Historically, researchers have relied on in situ observations collected by aircraft that fly near the storms and release dropwindsondes, instruments that radio back information such as wind speed and direction, temperature, pressure, and humidity values. Although costs associated with these missions are only a fraction of the cost of evacuating even one mile of coastline, continuing hurricane research budget cuts now dictate fewer flights, according to Forde.
With its wide swath coverage, SeaWinds data also promise significant improvements to computer forecast model accuracy. "With more precise input about ocean surface wind speed and the storm path direction, models can more accurately predict a hurricane's evolution and course," said Katsaros.
According to Forde, hurricane forecasting models are severely lacking in data from open ocean areas. For example, in 1998 a suite of reliable computer models predicted that Hurricane Bonnie could make landfall as far south as the Florida Keys, or as far north as North Carolina. Subsequent computer model runs that included data collected by a three-plane NOAA mission that flew into the storm, narrowed the range to a few hundred miles. "A thousand miles is quite a span," said Forde. "Imagine all those people up and down the coast buying bottled water and plywood from Home Depot."
Despite SeaWinds' obvious advantages, however, the instrument is not flawless. One limitation is that it is susceptible to errors caused by the presence of regional rain. "Rain can adversely affect the backscattered power measured by the radar," said Forde. "Since there is no sensor on the satellite to measure rain, any retrieved wind vectors in regions where it's raining will likely contain errors." The research team currently deals with this limitation by flagging data that may be contaminated, using black-colored "rain flags" to indicate areas where users should exercise caution in interpreting SeaWinds data.
SeaWinds can produce a detailed structure of a hurricane, as in this image of Hurricane Floyd. (Image courtesy of the Winds at JPL).
Another problem, one that is inherent with all scatterometers, is accurately determining wind speed and direction. "For each 25-square-kilometer QuikSCAT wind vector cell, four possible arithmetical solutions exist for wind direction," said Forde. Scientists at NOAA and NASA are working to refine the algorithms that help determine true wind direction and speed. "Improving the accuracy of the wind direction retrieval process will maximize the instrument's value to the meteorological community," said Forde.
NASA plans to launch another SeaWinds scatterometer in November 2001 aboard Japan's Advanced Earth Observing Satellite (ADEOS-II). According to Forde, the new scatterometer will be placed in an orbit that will complement QuikSCAT's measurements. "The two satellites together will provide an unprecedented view of all the Earth's oceans each day," he said.
Scientists at the NHC and NOAA's Hurricane Research Division (HRD) are also comparing and combining SeaWinds data with wind information from computer models, aircraft missions, satellites, and instruments that measure temperature, moisture, and relative humidity. In addition, QuikSCAT data are being incorporated into a surface-wind analysis system, developed by the HRD, to study surface windfields in tropical storms. "This model will help the NHC make decisions about warning the public when a storm threatens landfall," said Katsaros.
According to Forde, his team is quite pleased that the satellite is proving to be a valuable tool and that the hurricane forecasting and research communities are using QuikSCAT data. "By the end of the 1999 hurricane season, NHC was already regularly looking at QuikSCAT data," he said.
For more information
NASA Physical Oceanography Distributed Active Archive Center (PO.DAAC)
| About the remote sensing data used | ||
|---|---|---|
| Satellites | GOES SeaWiFS ERS-2 QuikSCAT | |
| Parameter | hurricane detection | |
| DAAC | NASA Physical Oceanography Distributed Active Archive Center (PO.DAAC) | |


