Access a range of datasets and data tools to further your heat research.
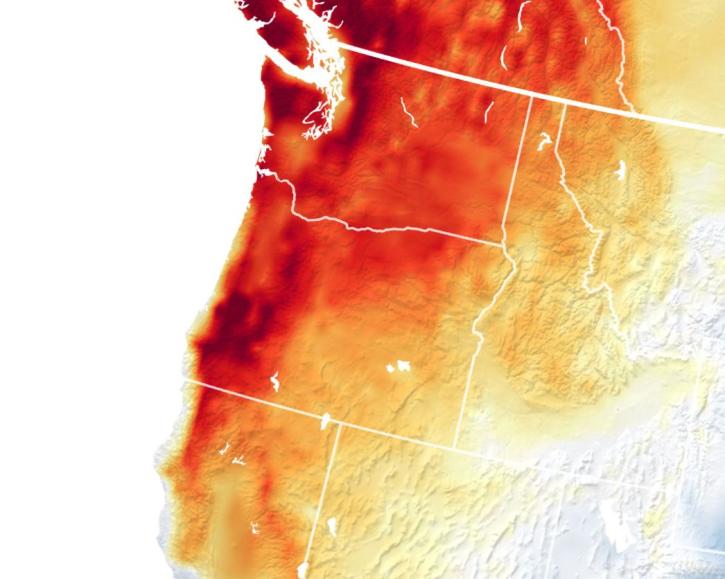
The public health impacts of heat waves include exhaustion, heat stroke, and even death. Extreme heat results in about 600 deaths per year in the U.S., with the elderly, very young, outdoor workers, and people with mental illness and chronic diseases at higher risk. In the 1960s, major cities in the U.S. averaged about two heat waves per year. In the 2010s, that number rose to more than six heat waves per year. Even under different climate models and emission scenarios, results indicate that extreme heat events are becoming worse.
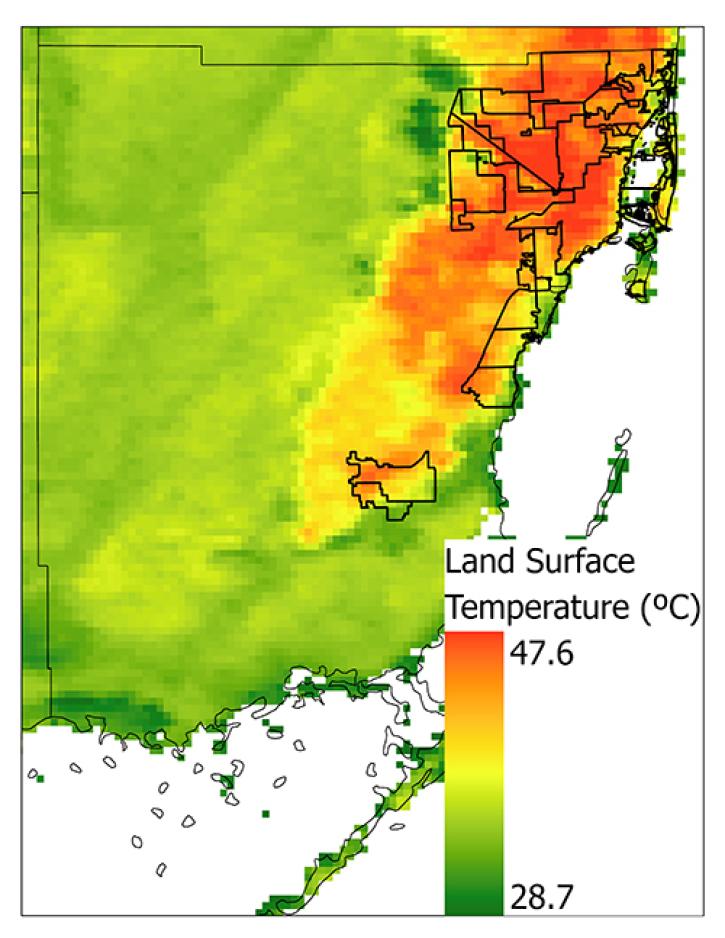
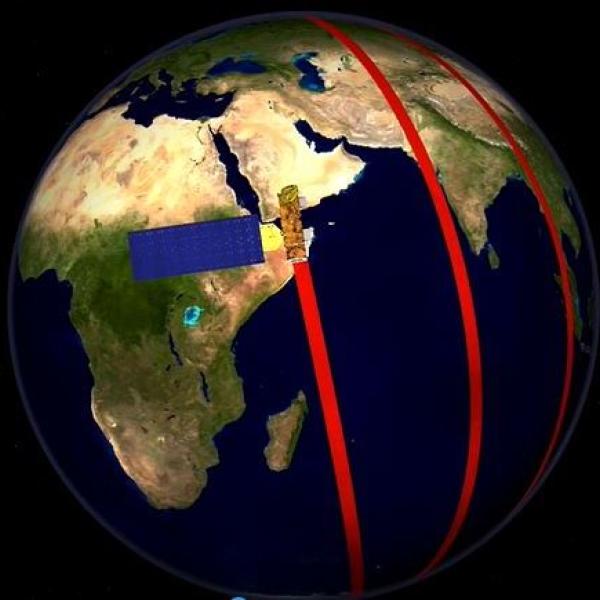
Records of temperature, humidity, and other environmental metrics, collected over decades, form a climate data record that can be used to reliably assess heat wave patterns and overall climate change. For example, NASA's Terra satellite has acquired land surface temperature data since 2000, and NASA's Aqua satellite has collected similar data since 2002. With consistent and continuous data coverage, reliable temperature and humidity anomalies can be assessed.
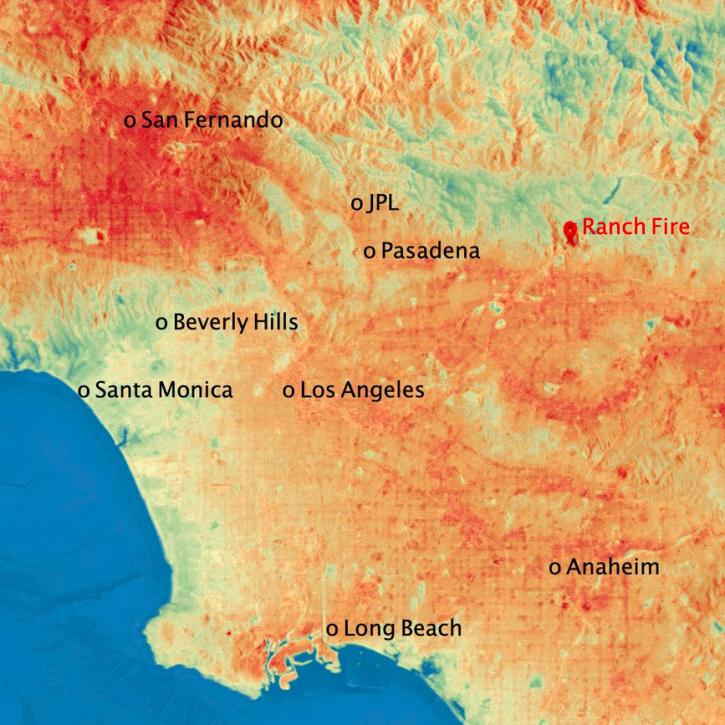
Heat-related deaths are preventable, but prevention requires a knowledge of where vulnerable populations exist and what interventions are needed in these communities. For example, the urban heat island effect represents the relatively higher temperatures found in urban areas compared to surrounding rural areas. In addition, socioeconomic status may limit a person's ability to deal with extreme heat. Increasing frequency of heat events and other natural disasters may lead to migration and a change in population composition.
NASA’s stores of Earth observation and socioeconomic data help researchers understand the effects of heat on the planet and its inhabitants. Our data products useful to the study of heat include global gas flare surveys, extreme heat estimates, and records of extreme heat exposure around the world.
Learn How to Use Heat Data


Join Our Community of NASA Data Users
While NASA data are openly available without restriction, an Earthdata Login is required to download data and to use some tools with full functionality.
Learn About the Benefits of Earthdata LoginFrequently Asked Questions
Earthdata Forum
Our online forum provides a space for users to browse thousands of FAQs about research needs, data, and data applications. You can also submit new questions for our experts to answer.
Submit Questions to Earthdata Forumand View Expert Responses