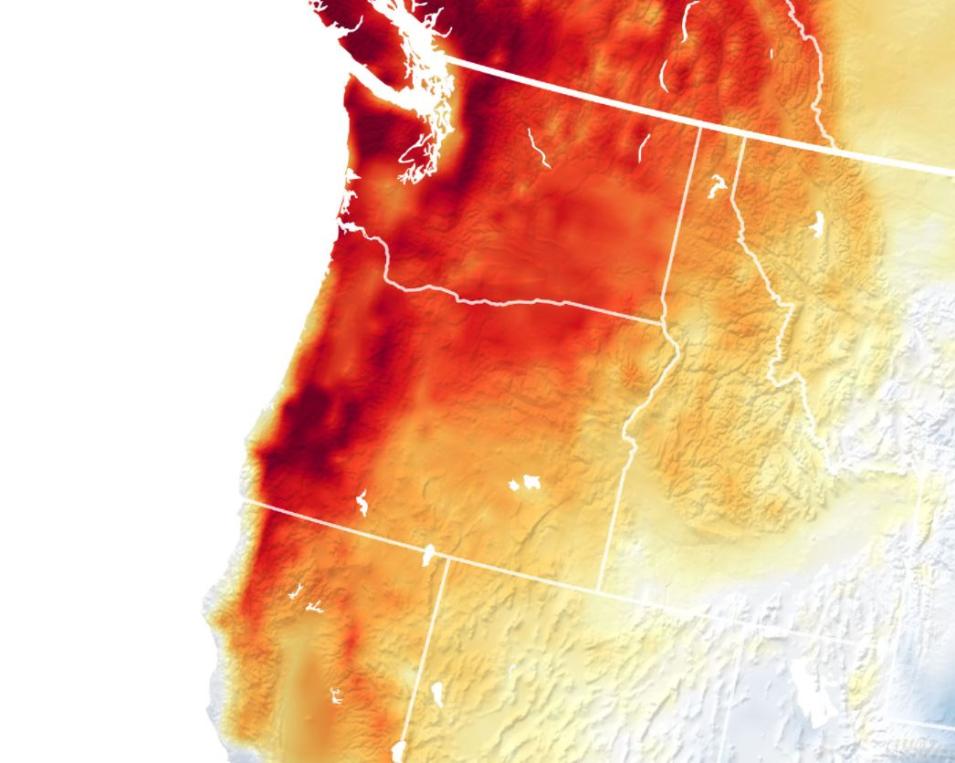
“Historic and dangerous”—that’s how the National Weather Service characterized the heat wave that roasted the Pacific Northwest at the end of June 2021, when all-time temperature records fell in multiple cities in the United States and Canada. On June 25, surface temperatures in Seattle reached 120°F (49°C) and, the next day, excessive heat warnings were issued across Washington, Oregon, and Northern California.
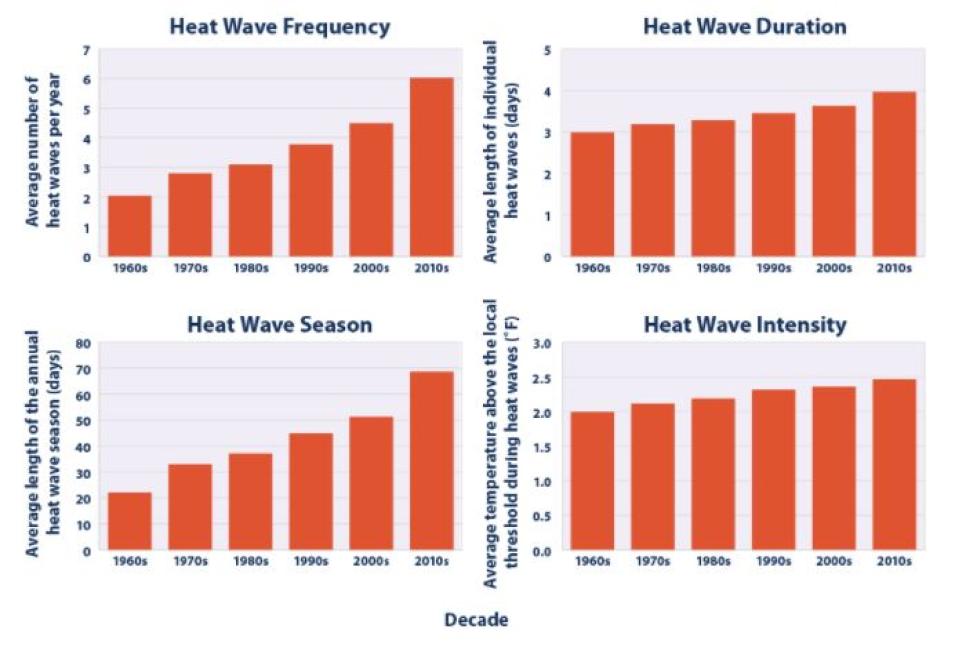
Of course, summer heat waves are nothing out of the ordinary, as unusually hot days are a natural part of day-to-day variation in the weather. However, according to information from the EPA, heat waves have become more frequent, longer-lasting, and more intense since the 1960s. Such findings are significant given that heat waves are more than just uncomfortable. Extreme heat can lead to illness and even death, particularly among older adults, the very young, and other vulnerable populations. In fact, according to reports from The New York Times, CNN, The Guardian, and other news outlets, the Pacific Northwest heat wave mentioned above killed more than 200 people in the region.
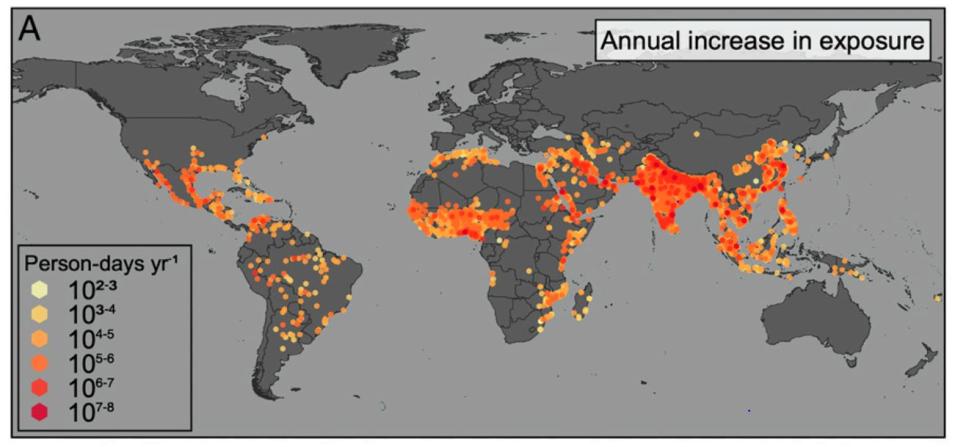
Therefore, as extreme heat events become more frequent, they’re likely to result in more heat-related illnesses and deaths, especially in communities that lack the resources to adapt. Yet, pinpointing which populations are most at risk can be difficult given the limited data pertaining to both urban population and extreme heat.
NASA’s Socioeconomic Data and Applications Center (SEDAC) has sought to address this limitation with the release of its Global High Resolution Daily Extreme Urban Heat Exposure (UHE-Daily), 1983–2016 dataset.
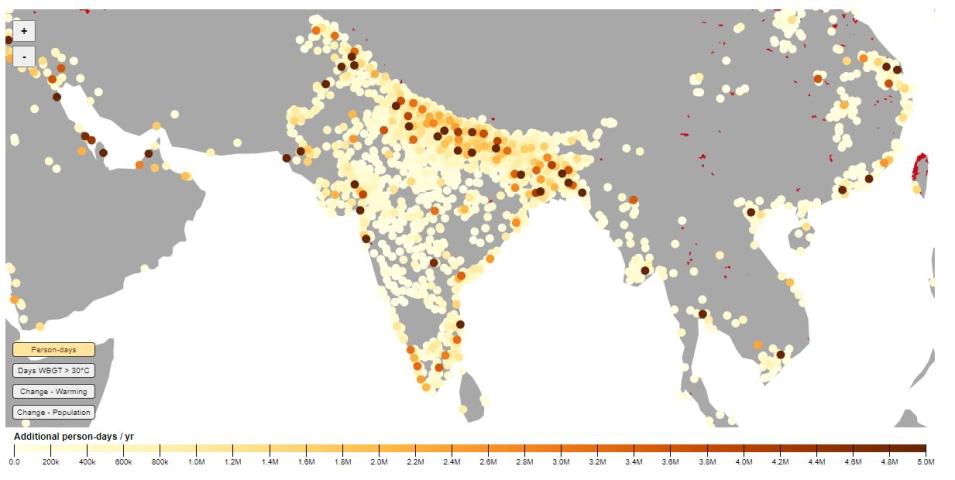
The new UHE-Daily dataset contains geolocated extreme heat events and urban population exposure estimates for more than 13,000 urban settlements worldwide from 1983 to 2016. Urban extreme heat events and urban population exposure are identified for each settlement in the data record at five combined temperature-humidity thresholds:
- Two-day or longer periods where the daily maximum heat index is greater than 40.6° Celsius (105° Fahrenheit)
- One-day or longer periods where the daily maximum heat index is greater than 46.1° Celsius (114° Fahrenheit)
- One-day or longer periods where the daily maximum wet bulb globe temperature—a measure of the heat stress in direct sunlight that comprises temperature, humidity, wind speed, sun angle, and solar radiation—is greater than 28, 30, and 32° Celsius (82.4, 86, and 89.6° Fahrenheit).
[Note: The maximum wet bulb globe temperature (WBGTmax) thresholds follow the International Standards Organization criterion for risk of occupational heat illness, whereas the daily maximum heat index (HImax) thresholds follow the U.S. National Weather Service’s definition for an excessive heat warning.]


