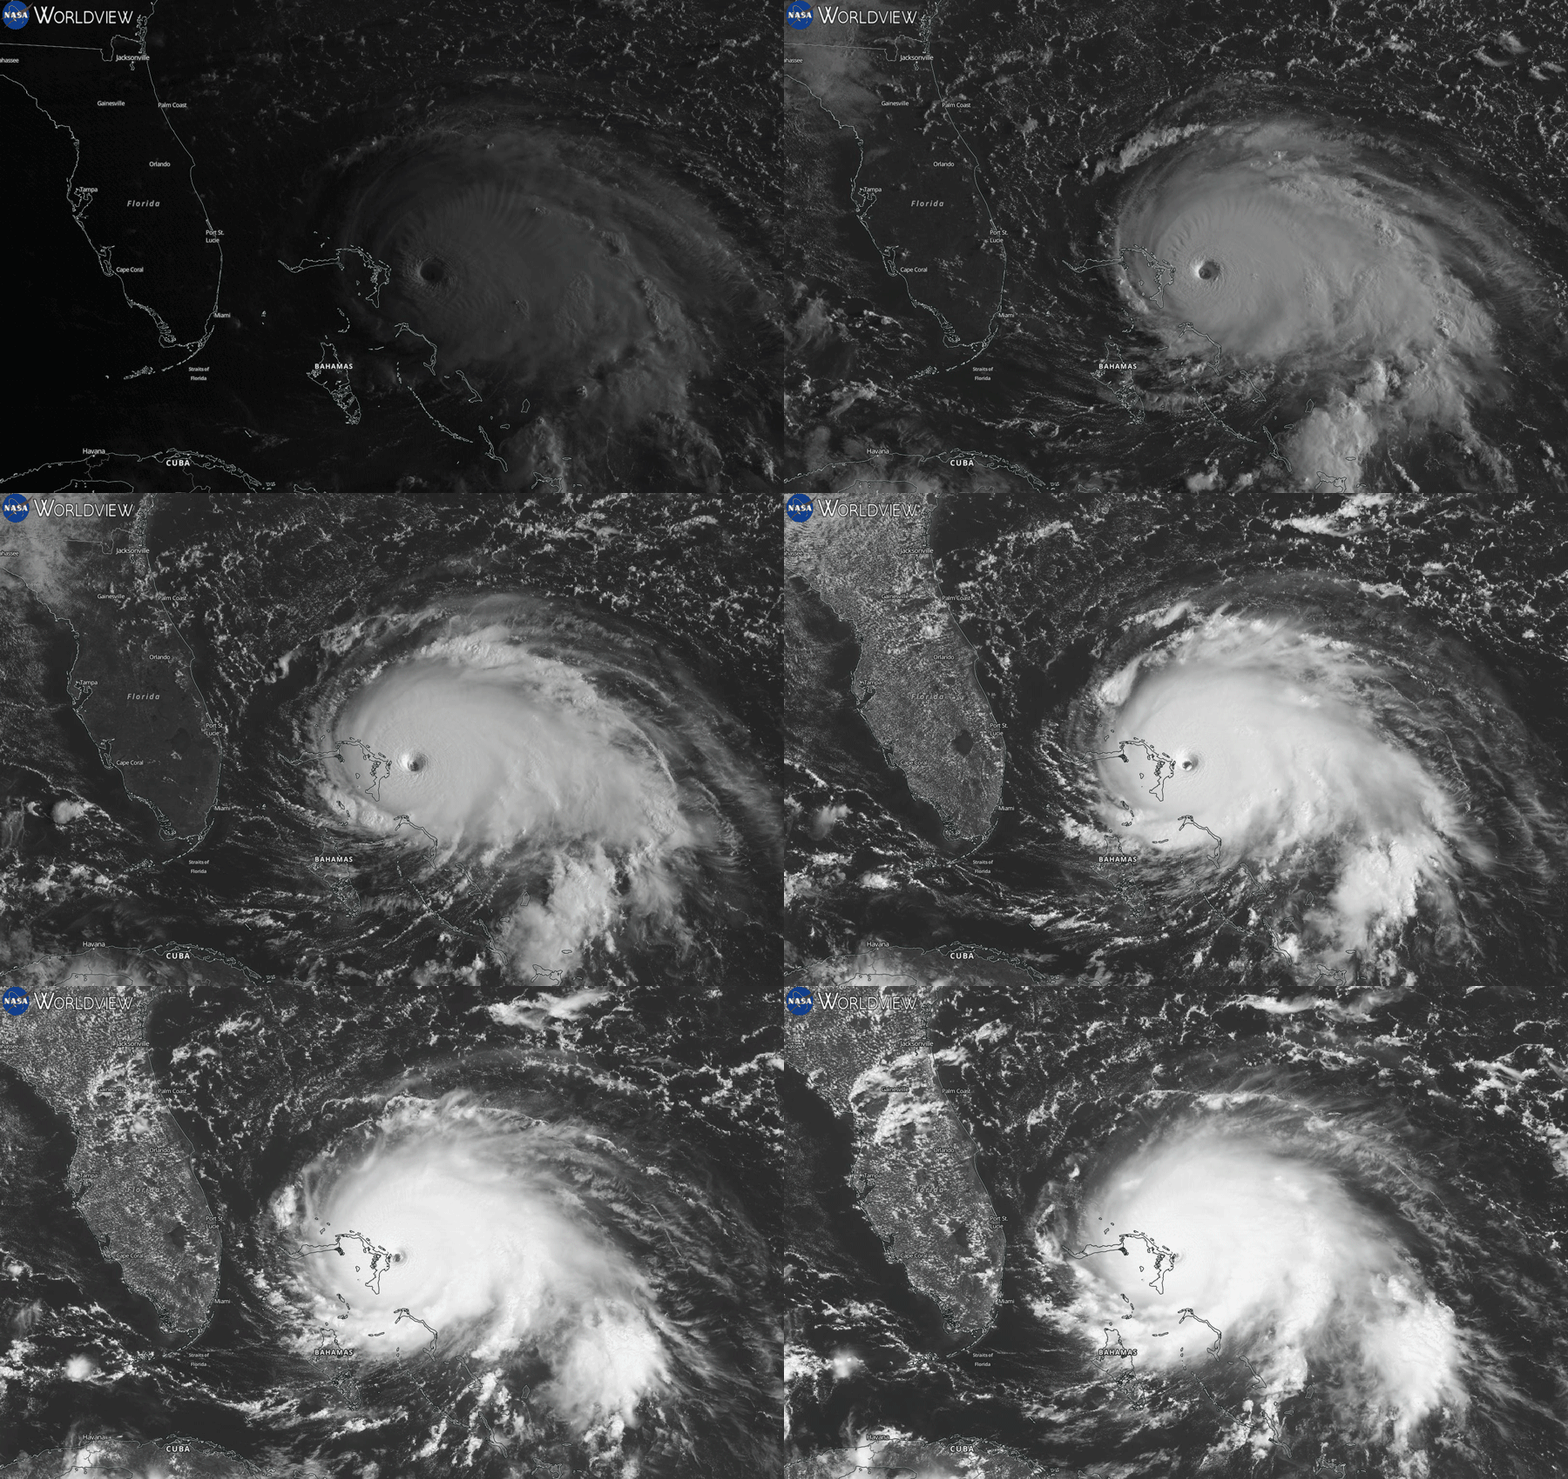
As the sun came up on September 1, 2019, the eye of Hurricane Dorian was fast approaching the Abaco Islands in the Bahamas. The Category 5 hurricane hit the islands at 12:40 p.m. local time with maximum sustained winds of 298 kilometers per hour (185 miles per hour).
The movement of the storm was captured by the Geostationary Operational Environmental Satellite-East (GOES-East) Advanced Baseline Imager (ABI). GOES-East and GOES-West are joint NASA/NOAA geostationary satellites that provide data on storm evolution by measuring infrared and visible radiation. The GOES imagery is available in 10 minute increments and made available through NASA’s Global Imagery Browse Services (GIBS) and Worldview interactive data visualization application approximately 40 minutes after it is captured by the satellite.
GOES imagery is provided to GIBS by the Short-Term Prediction Research and Transition (SPoRT) project, based at NASA’s Marshall Space Flight Center in Huntsville, Alabama. SPoRT is a NASA project to transition unique observations and research capabilities to the operational weather community to improve short-term forecasts. "Imagery from the GOES ABI instrument is really helpful for seeing the big picture of potential hurricane activity in the Atlantic," said Patrick Duran, Research Physical Scientist at SPoRT.
SPoRT scientists use data and imagery from a number of sources to monitor hurricanes. Near real-time data, which are typically defined as being available within three hours after being captured by satellite, allow scientists to track storms before they begin and during their evolution.
When thunderstorms in the ocean organize and rotate, they can become a tropical storm if their winds exceed 63 kilometers per hour (39 miles per hour). Tropical storms are given a name based on a convention set by the World Meteorological Organization. If winds exceed 119 kilometers per hour (74 miles per hour), they become a cyclone. A tropical cyclone is known as a hurricane in the North Atlantic and in the central and eastern North Pacific. In the Northwest Pacific the term typhoon is used.
The official start of the Atlantic hurricane season was June 1, and before the season started, two tropical storms were named. Having two named storms before the start of the season has only happened five times since 1990, Phil Klotzbach, Research Scientist in the Department of Atmospheric Science at Colorado State University, told CNN.
Hurricane Genesis
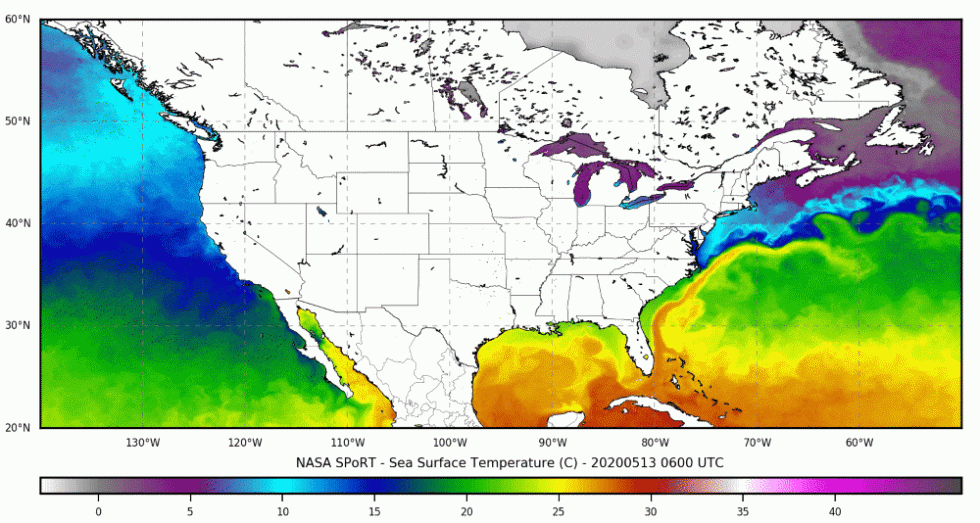
Hurricanes are dependent on warm waters from which they draw heat and energy to form and intensify. Erika Duran, Research Associate with SPoRT and the University of Alabama in Huntsville, analyzes data on sea surface temperature (SST) and other environmental parameters to help forecast tropical cyclones.
"SST data are really important both before and after storm development," said Erika Duran. "This helps you see where the ocean temperatures are warm enough to support hurricane development."
SPoRT produces composite maps of sea surface temperature (SST) twice daily using data from several sources, including NASA’s Visible Infrared Imaging Radiometer Suite (VIIRS) and Moderate Resolution Imaging SpectroRadiometer (MODIS) instruments, and products from the National Environmental Satellite Data and Information Service (NESDIS) GOES and the United Kingdom Met Office (UKMO) Operational Sea Surface Temperature and Sea Ice Analysis (OSTIA). SPoRT obtains the VIIRS, MODIS and OSTIA data in near real-time from the Group for High Resolution Sea Surface Temperature (GHRSST) at NASA’s Jet Propulsion Laboratory (JPL). The composite SST dataset is at a 2 km resolution and is used in NASA's disasters program web mapping portal.
GHRSST provides a number of SST datasets from GOES instruments and instruments in low-Earth orbit, with latencies ranging from 30 minutes to one day.
Multi-instrument SST datasets are key to getting data in a timely way. Orbits of satellites in low-Earth orbit (generally defined as an orbit of 2,000 km from the Earth’s surface or lower) have low temporal resolution. But combining their measurements with those from geostationary satellites, which orbit at the same speed as Earth’s rotation about 36,000 km from the surface, provide a constant view of the same surface, allowing for monitoring ocean activity in near real-time.
As storms intensify, wind speeds increase. SPoRT scientists closely monitor wind speeds of a storm to understand and better forecast conditions in which storms become hurricanes.
Patrick Duran has been using data from NASA’s Soil Moisture Active Passive (SMAP) instrument to look at wind speeds during the storm. Although the SMAP mission’s primary focus is providing science-quality soil moisture data, JPL has developed a dataset from the instrument to monitor extreme wind speeds. "Meteorological centers across the globe use SMAP wind speed data to monitor storm development," said Patrick. This dataset is available on Earthdata Search from 2014 to present with a six hour latency from processing to availability. Patrick also uses data from the Cyclone Global Navigation Satellite System (CYGNSS) to look at wind speeds, which are provided with a six day latency.
On September 1, the day Hurricane Dorian made landfall, winds surged from 241 kilometers per hour (150 miles per hour) to 298 kilometers per hour (185 miles per hour) within nine hours. Although people pay close attention to wind speeds close to the center or eye of the storm, it’s also critical to track wind speeds on the outer parts of the storm, Patrick said, because these winds often cause the majority of the storm surge, which is the biggest hazard to people and property.
In the Eye of the Storm
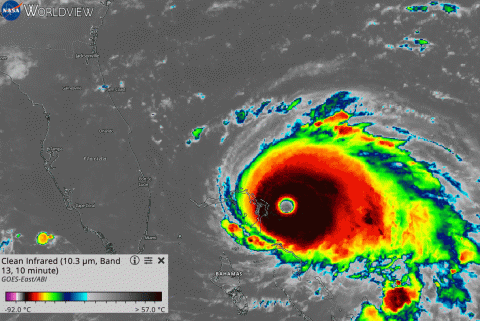
The Clean Infrared (10.3μm) layer from GOES-East shows the cloud-top brightness temperatures near the center of Hurricane Dorian as it hits the Bahamas on September 1.
The more intense the storm, the higher clouds reach into the atmosphere, making clouds colder. In the graphic, clouds near the center of the storm (in black) are below -70°C.
Another way to peer into the eye of the storm is with passive microwave data from the international network of satellites that make up the joint NASA, Japan Aerospace Exploration Agency (JAXA) Global Precipitation Measurement (GPM) mission. Weather forecasters look for signs of rapid intensification by studying the internal structure of storms, such as their eyewalls and rain bands.
"Passive microwave imagery in particular is really useful for seeing the structure of rain bands and thunderstorms within the hurricane itself. There are important features you can see in the microwave imagery that are often obscured by clouds in optical imagery," said Erika. One of the dozen instruments in the network of GPM satellites is Advanced Microwave Scanning Radiometer-2 (AMSR-2) aboard JAXA’s Global Change Observation Mission - Water 1 (GCOM-1W) satellite, which provides passive microwave data and is used to track rainfall over the ocean. Passive microwave data from GPM can be viewed at SPoRT and AMSR-2 data can be viewed on Worldview and downloaded from LANCE.
Using data from the Geostationary Lightning Mapper (GLM) aboard GOES-East, Patrick Duran and colleagues at SPoRT are undergoing new research looking at how patterns of lightning strikes and intensity change as hurricanes develop. With Hurricane Dorian there were two events with a lot of lightning activity. One when the storm was intensifying and one when it was weakening. "When the storm was intensifying, the area and energy of flashes were a lot larger in the inner core of the storm. When the storm was weakening, there was once again an outbreak of lightning, but the lightning was on the periphery of the storm and the energy was not as intense."
The Lightning Imaging Sensor (LIS), installed on the International Space Station in 2017, is also used to measure lightning activity. LIS is a well-understood instrument from its time on the joint NASA/JAXA Tropical Rainfall Measuring Mission (TRMM) satellite, which was operational from 1997 to 2015. LIS currently provides important cross-sensor calibration and validation with GLM measurements.
Better Data, Better Forecasts
"We’ve seen huge improvements in recent decades in hurricane forecasting, as data assimilation, technology, and satellites have gotten better,” said Erika Duran. “These improvements have had a direct impact on our ability to forecast where a storm is going."
The SPoRT team is now anticipating the launch of a new NASA Earth Venture Mission designed for observing tropical cyclones (i.e., hurricanes and typhoons) called Time-Resolved Observations of Precipitation structure and storm Intensity with a Constellation of Smallsats (TROPICS). The TROPICS science team is led by William Blackwell at the Massachusetts Institute of Technology, and includes researchers from NASA, NOAA, and other universities.
It is slated to launch no earlier than 2021 and will measure temperature, moisture profiles, and precipitation in tropical systems with unprecedented temporal frequency. These data will enable scientists to study the inner core of storms in near real-time, which will aid forecasts of storm intensification. "The temporal frequency of TROPICS passive microwave data will be a huge improvement over the current constellation of passive microwave instruments. It will provide detailed information about the storm environment and even the inner core every hour," Erika added.
Read more about near real-time data used in severe storm forecasts on the SPoRT and LANCE pages. Explore the Cyclones Data Pathfinder for direct access to commonly-used datasets in both pre-storm and post-storm assessments.
| Remote Sensing Data Referenced in Article | Archive Information |
|---|---|
| SPoRT composite maps of sea surface temperature (SST) are provided twice a day. | Data are provided by NASA SPoRT. |
| The Group for High Resolution Sea Surface Temperature (GHRSST) provides a number of SST products, for different user needs, with latencies ranging from 30 minutes to one day. | Provided by NASA's Physical Oceanography Distributed Active Archive Center (PO.DAAC): doi: 10.5067/GHGMR-4FJ04 |
| Soil Moisture Active Passive (SMAP) extreme winds orbital/swath product is available on Earthdata Search with a latency of approximately six hours. | Provided by PO.DAAC: doi: 10.5067/SMP43-2NOCS |
| Advanced Microwave Scanning Radiometer-2 (AMSR-2) aboard Japan Aerospace Exploration Agency’s (JAXA) Global Change Observation Mission - Water 1 (GCOM-1W) satellite provides global passive microwave measurements of terrestrial, oceanic, and atmospheric parameters for the investigation of global water and energy cycles. Near real-time AMSR-2 products are generated within three hours of observation by LANCE. | Provided by the Global Hydrology Resource Center DAAC (GHRC DAAC): doi: 10.5067/AMSR2/A2_RainOcn_NRT |
| Geostationary Lightning Mapper (GLM L2+ Data Product) data from GOES-East are available from NOAA with a latency of approximately one hour. | Data are provided by NOAA. |
| Lightning Imaging Sensor (LIS) aboard the International Space Station (ISS) provides total lightning measurements between +/- 48 degrees latitude which includes nearly all global lightning. Available from LANCE three to five hours after observation. | Provided by GHRC DAAC: doi: 10.5067/LIS/ISSLIS/DATA106 |
Published June 9, 2020


