NASA’s Oak Ridge National Laboratory Distributed Active Archive Center (ORNL DAAC) produces and archives Daymet data, which supply gridded estimates of daily weather parameters throughout North America. The Daymet Version 3 daily surface weather and climatological summaries recently have been updated to include all years 1980 through 2018 for continental North America, Puerto Rico, and Hawaii. Daymet output variables include the following parameters: minimum temperature, maximum temperature, precipitation, shortwave radiation, vapor pressure, snow water equivalent, and day length. The following recent peer-reviewed articles illustrate how researchers are using Daymet to inform a variety of applications.
Daymet Data in Recent Research
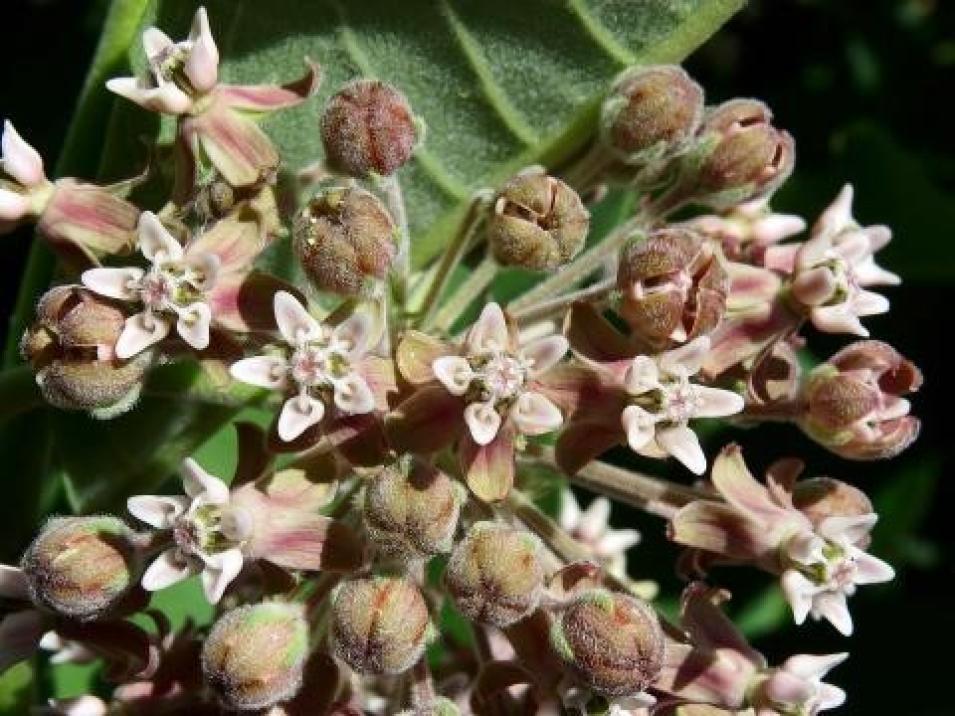
Daymet data were used to study the influence of climate change on the phenology (the timing of a plant’s life cycle) of Asclepias syriaca (common milkweed). A. syriaca is a flowering plant native to much of the U.S. that relies on a variety of insects for pollination. Howard (2018) hypothesizes that the phenology of A. syriaca has been modified by climate change. The author retrieved daily maximum temperature and precipitation values from Daymet for the locations of individual A. syriaca plants recorded in the U.S. National Phenology Network database and quantified the relationship between climatic variables and the flowering dates of the plants. The results show that higher temperatures are correlated with earlier milkweed flowering dates.
Phenological studies are important because earlier flowering dates can lead to “mismatches” between the phenology of when a plant flowers and when insects are available to pollinate the plant. According to Howard (2018), “Given A. syriaca’s potential susceptibility to the negative consequences of phenological shift, recent decline, and importance as a host plant, it is critical to this plant’s future conservation that its potential response to climate change is investigated.”
Publication: Howard, A.F. (2018). “Asclepias syriaca (Common Milkweed) flowering date shift in response to climate change.” Scientific Reports, 8(1):17802. doi: 10.1038/s41598-018-36152-2
Daymet data aid research on responses of vegetation to climate variability across Yellowstone National Park
Daymet was used in combination with remotely-sensed land products to inform an analysis of changes in vegetation across Yellowstone National Park in Wyoming. To identify ecological vulnerability and guide resource management in the Western U.S., a region that experiences periodic water scarcity, Notaro et al. (2019) retrieved temperature, precipitation, surface solar radiation, and snow-water equivalent data from Daymet. The authors identified which climate variables varied most across the study area and how those changes related to the health and seasonality of vegetation. In addition, they constructed a timeseries of monthly anomalies of both climate and vegetation variables to demonstrate how vegetation patterns varied across the park in recent decades.
Yellowstone National Park is the oldest official national park in the U.S., has a largely pristine environment, and has been the subject of intense environmental research. Through their exploration of the complex interactions between climate and vegetation, Notaro et al. (2019) offer new insights into how climate change is manifest across a variety of topographic, climatic, and ecological gradients.
Publication: Notaro, M., Emmett, K. & O’Leary, D. (2019). “Spatio-Temporal Variability in Remotely Sensed Vegetation Greenness Across Yellowstone National Park.” Remote Sensing, 11(7):798. doi: 10.3390/rs11070798
The U.S. Geological Survey (USGS) incorporates Daymet into hydrologic modeling applications
Daymet has been used in configurations of a national hydrologic model that aims to enable more effective water resources planning and management. The USGS developed the National Hydrologic Model (NHM) infrastructure “to support coordinated, comprehensive, and consistent hydrologic modeling at multiple scales for the conterminous United States.” When the model is configured for use in Precipitation-Runoff Modeling (NHM-PRMS), it includes precipitation and minimum and maximum temperature derived from Daymet.
The authors, Regan et al. (2019), note that the rationale for the NHM is to provide consistent and relevant simulations of watershed-scale hydrologic processes for effective management of water resources. Moreover, incorporating variations of local parameters into the model can contribute to studies on specific geospatial areas or conditions.
Publication: Regan, R.S., Juracek, K.E., Hay, L.E., Markstrom, S.L., Viger, R.J., Driscoll, J.M., LaFontaine, J.H. & Norton, P.A. (2019). “The U.S. Geological Survey National Hydrologic Model infrastructure: Rationale, description, and application of a watershed-scale model for the conterminous United States.” Environmental Modelling & Software, 111:192-203. doi: 10.1016/j.envsoft.2018.09.023
Daymet Datasets at NASA’s ORNL DAAC: Thornton, P.E., Thornton, M.M., Mayer, B.W., Wei, Y., Devarakonda, R., Vose, R.S. & Cook, R.B. (2018). “Daymet: Daily Surface Weather Data on a 1-km Grid for North America, Version 3.” doi: 10.3334/ORNLDAAC/1328
Thornton, M.M., Thornton, P.E., Wei, Y., Mayer, B.W., Cook, R.B. & Vose, R.S. (2018). “Daymet: Annual Climate Summaries on a 1-km Grid for North America, Version 3." doi: 10.3334/ORNLDAAC/1343
Thornton, M.M., Thornton, P.E., Wei, Y., Mayer, B.W., Cook, R.B. & Vose, R.S. (2018). “Daymet: Monthly Climate Summaries on a 1-km Grid for North America, Version 3." doi: 10.3334/ORNLDAAC/1345
Thornton, M.M., Thornton, P.E., Wei, Y., Vose, R.S. & Boyer, A.G. (2018). “Daymet: Station-Level Inputs and Model Predicted Values for North America, Version 3." doi: 10.3334/ORNLDAAC/1391
Thornton, P.E., Thornton, M.M. & Vose, R.S. (2018). “Daymet: Annual Tile Summary Cross-Validation Statistics for North America, Version 3." doi: 10.3334/ORNLDAAC/1348
