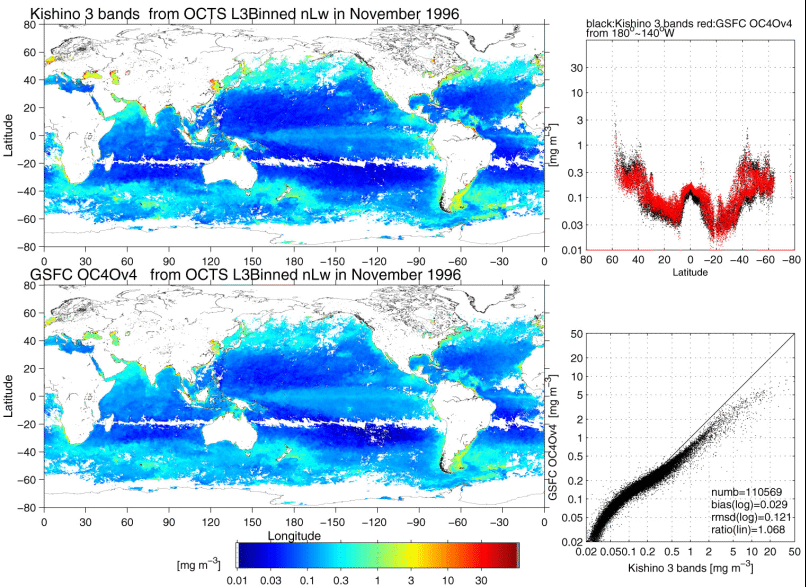
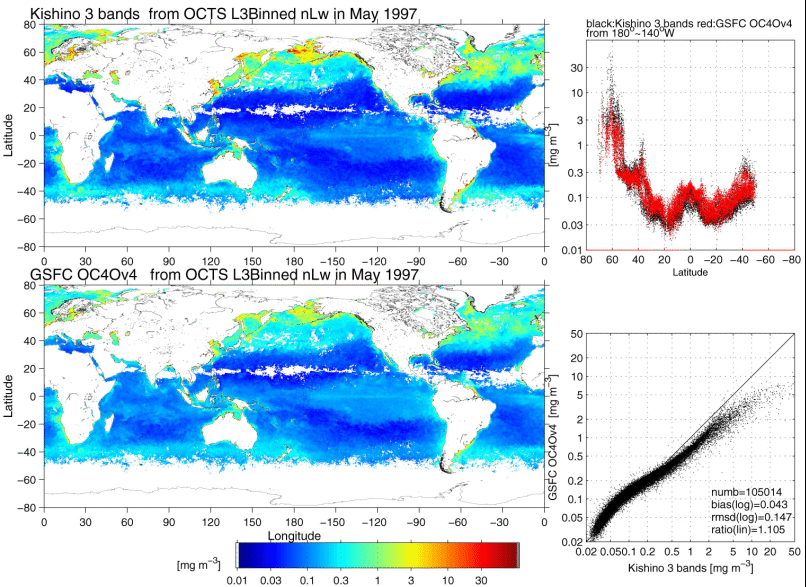
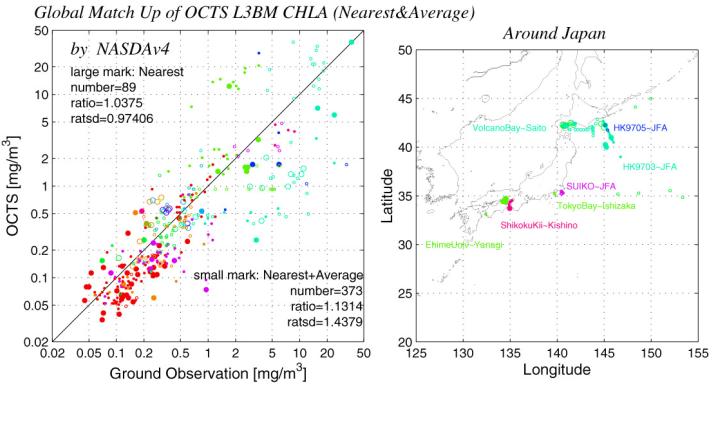
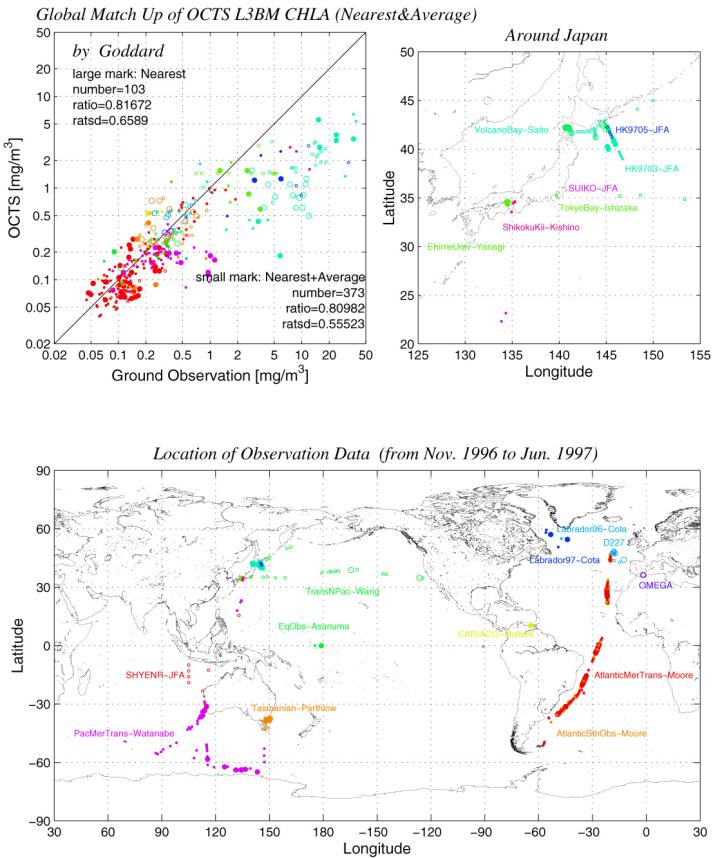
The PDF file—his_octs_goddard.pdf—shows histogram comparisons between the NASDA version 4 products and those produced by NASA. The gif image—octs_hist_scatter.gif—shows scatter diagrams of NASDA version 4 and NASA products. Note that the bias, rms, and averages are calculated in the log-domain for chlorophyll results.
Below are global comparisons of chlorophyll-a retrievals from NASDA version 4 processing and SIMBIOS processing.