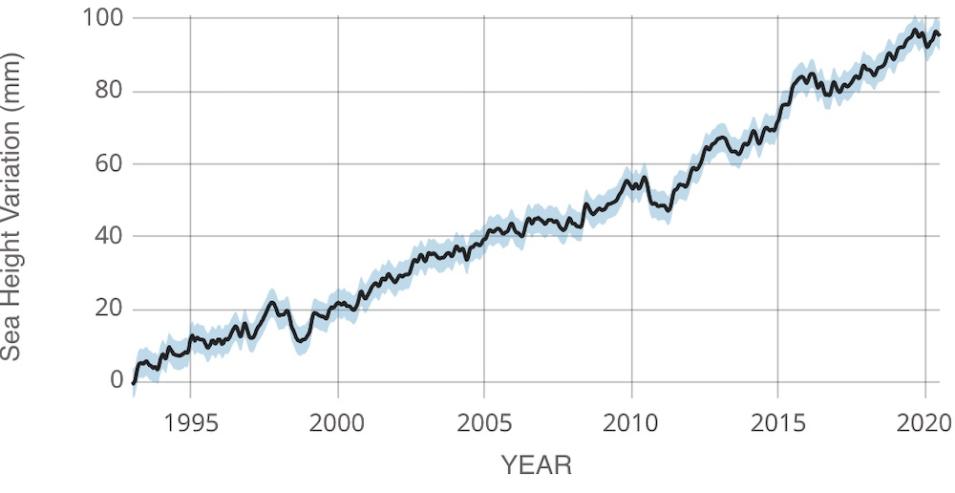
Sea levels are rising at an average of 3.3 millimeters per year around the world. Rising seas are already having catastrophic effects in coastal communities through flooding, erosion, and storm-related hazards.
Scientists now have an unprecedented understanding of changing sea levels, thanks to data collected and distributed by NASA and partner space agencies. For example, international satellites have collected almost 30 years of data on sea surface height from satellite altimeters.
But no single satellite instrument can provide a complete picture of the status and drivers of rising seas around the world.
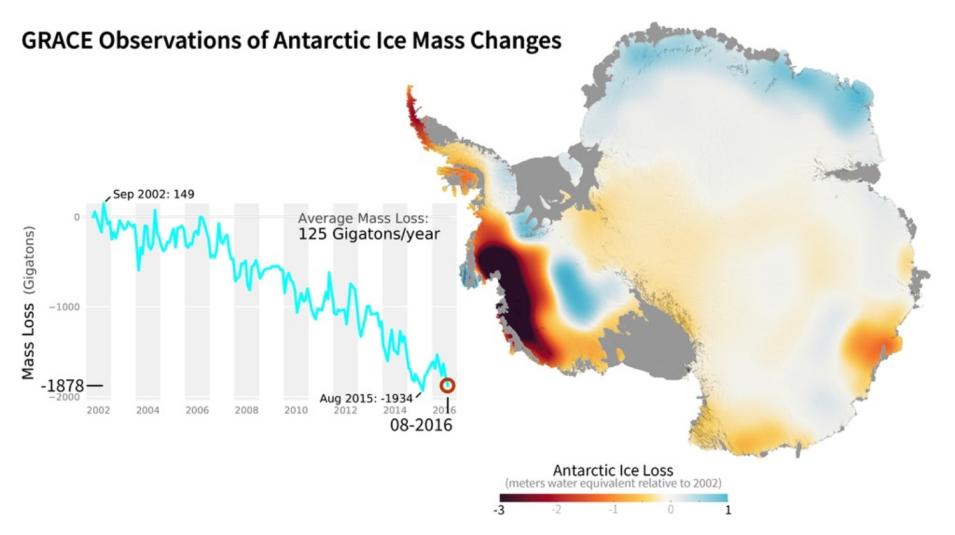
Melting ice sheets, thermal expansion of water, and terrestrial freshwater use are just some of the major factors contributing to rising sea levels. Piecing together the drivers of sea level change requires a diversity of datasets and a long time series from many satellite instruments.
The new Sea Level Change Data Pathfinder delves into many of the datasets scientists use to study the status of global and regional sea level change.
Sea Surface Height
When scientists refer to changes in sea level, they are referring to changes in the height of the mean sea surface relative to a mean sea level defined by Earth’s geoid. Earth’s geoid is defined as the mean sea surface due to the pull of gravity on the ocean. Satellite altimeters very accurately provide measurements of sea surface height by timing a roundtrip radar signal from the satellite to the ocean surface and back to the satellite. These measurements are used to calculate Global Mean Sea Level.
Starting in August 1992, four satellite missions have provided a long time series of sea surface height: the TOPEX/Poseidon (T/P) altimetric mission, a joint effort between NASA and the French space agency Centre National d'Etudes Spatiales; Jason-1; the Ocean Surface Topography Mission (OSTM)/Jason-2; and now the ongoing Jason-3.
Launching in November, 2020, the new Sentinel-6 Michael Freilich mission is a follow-on to the Jason altimeter missions and will ensure the continuation of a decades-long record of sea level observations through at least 2030. The mission is being developed in collaboration with the European Space Agency, the European Organisation for the Exploitation of Meteorological Satellites, and NOAA.
Drivers of Sea Level Rise
The Data Pathfinder provides a thorough list of datasets scientists use to understand the different drivers of changing sea levels. Scientists use these datasets to piece together a sea level “budget". Some factors, like melting glaciers and thermal expansion, add to sea levels, while others, like damming freshwater on land, can take away from them. When we add up all of the factors, they should produce an estimate in line with an average observed change in sea levels, or global mean sea level rise.

