Preparing for PACE Data

Simulated data help Plankton, Aerosol, Cloud, ocean Ecosystem (PACE) users prepare a day in the life of the new satellite.
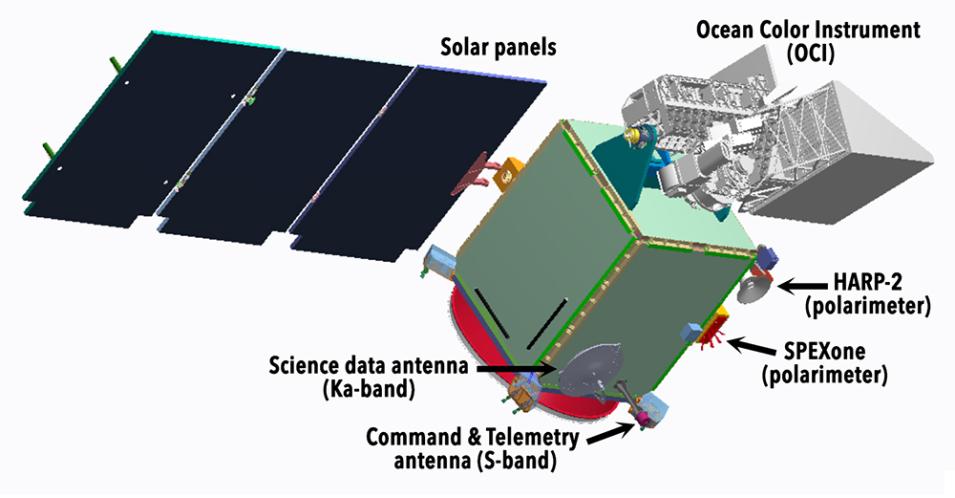
This is an image of the PACE spacecraft and its instruments. In the upper left of the image are three solar panels connected to a square-shaped, green satellite chassis in the middle of the frame. Mounted to the chassis are the Spectro-Polarimeter for Planetary Exploration (SPEXone) and the Hyper Angular Research Polarimeter (HARP2), and two communications antennas. Attached to the right side of the chassis is the Ocean Color Instrument (OCI), colored silver.
Image Caption

The PACE spacecraft and its instruments. The primary instrument, the Ocean Color Instrument (OCI), is located at top right. The Spectro-Polarimeter for Planetary Exploration (SPEXone) and the Hyper Angular Research Polarimeter (HARP2) are found in the lower right. Credit: NASA's Goddard Space Flight Center.

When NASA's Plankton, Aerosol, Cloud, ocean Ecosystem (PACE) satellite launched into space on February 8, 2024, the team was excited for the spacecraft to begin its mission. This is not only because the endeavor was more than a decade in the making and critical for understanding Earth's ocean, atmosphere, and climate change. The team was also ready for launch knowing they had expertly prepared themselves by using simulated data to test and practice using PACE's sensors and data systems to ensure that global data users would get the quality science data they need.

"The simulated data provided confidence to our group and proved that we could successfully push bits through the science data processing system while also carefully identifying any gaps and issues to resolve," said PACE Project Scientist Dr. Jeremy Werdell. "The data in combination with other tools showed us we can expect PACE's instruments to perform extremely well."

PACE is equipped with three sensors. The Spectro-Polarimeter for Planetary Exploration (SPEXone) and the Hyper Angular Research Polarimeter (HARP2) are aboard to study clouds and aerosols. PACE's primary sensor is the Ocean Color Instrument (OCI), which is a highly advanced optical spectrometer that measures light reflected by the ocean. And ocean color is a key element of assessing ocean health.

Microscopic algae called phytoplankton make up a tremendous amount of ocean biomass. Phytoplankton and their plumes can change the wavelengths of light absorbed or reflected by water and, through this, ocean color. Precisely measuring the ocean color and tracking plumes of phytoplankton will aid scientists in understanding ocean ecology and provide essential information for climate studies.

The OCI can measure the color reflected by the ocean and other properties of ultraviolet to infrared light across nearly 300 wavelengths, providing greater detail than any previous ocean color mission. PACE will complete surveys of the entire globe every two days and provide data and imagery at a resolution of 1.2 km (0.75 miles).

Given the advanced and complex nature of the OCI, NASA needed realistic data to simulate using it ahead of launch.

Why Use Simulated Data?

Before a satellite mission begins, scientists and others need data to test, trial, estimate, or simulate how sensors and systems will produce data and products. Sometimes they can use what's known as proxy data, which are data from another source or satellite similar to what the new instrument will output.

"Early on we used data from the Airborne Visible/Infrared Imaging and Portable Remote Imaging Spectrometers as proxies for OCI, but quickly realized we needed something more," said Sean Bailey, manager of NASA's Ocean Biology Distributed Active Archive Center (OB.DAAC). OB.DAAC archives and distributes NASA ocean color data, and will be the home for PACE data.

That something more were simulated data, which are data generated to exactly match the format of the data produced by the sensor being used, such as the OCI.

"Simulated data could simply be a test pattern or even just constant values written into the expected data format to test the code and production mechanics of a data system," said Bailey. "What is even better is to simulate geophysically realistic data, which can not only test the mechanics of the code, but also, to an extent, test the validity of the processing algorithms."

Putting OCI Through its Paces

For PACE's OCI, NASA's Ocean Biology Processing Group developed a program called the Python Top of Atmosphere Simulation Tool (PyTOAST) to produce simulated Level 1B data. The data precisely mimic OCI sensor data, account for atmospheric effects on reflected light, and allow the team to mechanically test both the processing system code and detection algorithms. PyTOAST incorporates products and data from the Moderate Resolution Imaging Spectroradiometer (MODIS); the Visible Infrared Imaging Radiometer Suite (VIIRS); the Modern-Era Retrospective analysis for Research and Applications, Version 2 (MERRA-2); and other sources to produce radiometric data just like what PACE will record in space.
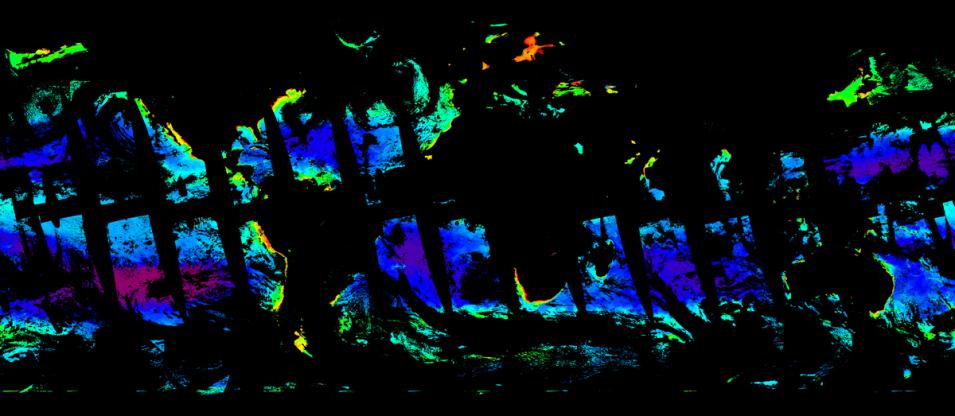
This is an image showing simulated chlorophyll concentrations in the ocean on March 21, 2022. The image has a black background. Regions colored in blue represent areas of low chlorophyll concentration, green are medium, and red areas have high levels. The image has strips of black running through the colored areas from the upper left to the lower right to show PACE’s orbital track around the globe and places across the ocean where it has not scanned.
Image Caption

This image shows global PACE ocean chlorophyll concentration data for March 21, 2022, as generated by processing simulated OCI data from the Python Top of Atmosphere Simulation Tool (PyTOAST) through the at-launch science algorithms. Regions colored in blue represent areas of low chlorophyll concentration, green are medium, and red areas have high levels. The black strips represent PACE's orbital track and areas where it has not scanned the ocean. Credit: NASA's OB.DAAC.

"Nothing else like PyTOAST exists," said Bailey. "There are other tools that can simulate a top of atmosphere signal, but these are computationally expensive and cannot be readily scaled to produce full global coverage at the roughly 1 km resolution of PACE's OCI. With PyTOAST, we generated weeks' worth of simulated OCI data in a couple of days."

The initial development of PyTOAST and the OCI data had its computing challenges. The OCI's ability to capture relatively fine details means its data files are immense. A single five-minute granule of data from the sensor includes millions of pixels, requiring a great deal of time and computer power to process.

"The computational requirements are significantly more than what is required by any other heritage spaceborne ocean color sensors—about one order of magnitude—representing a substantial increase in complexity," said PACE ocean scientist Dr. Amir Ibrahim, PyTOAST's initiating developer. "To mitigate some of these computational challenges, we turned to machine learning techniques. These techniques enabled us to compress the data and enhance computational efficiency, ensuring smooth integration into the data production systems."

A Day in the Life of PACE

In addition to the development of simulated OCI data, related work was completed by SRON (Netherlands Institute for Space Research) for SPEXone and by a team from NASA and the University of Maryland, Baltimore County for HARP2. The PACE project team then took the simulated data from all three sensors to create a day in the life (DITL) test for March 21, 2022, and produce realistic examples of PACE's data products.

"In combination with proxy data derived from real prelaunch instrument test data, this DITL was a critical tool for testing and refining the end-to-end data acquisition and science processing codes in our production environment, giving us high confidence that we would be ready to produce the expected science data products from PACE at first light," said Bryan Franz, leader of PACE's science data segment.

The first PACE science data products are expected to be available at NASA's OB.DAAC in April 2024. Thanks to the simulated data and their work with these data on a day in the life of PACE, users can look forward to these products with the same anticipation as the PACE launch. Like the mission team, practitioners can be confident knowing the data come from high-performing sensors using systems that have been thoroughly tested and tweaked and found more than ready to serve the scientific community.

Details

Last Updated

Published

Data Center/Project

Ocean Biology DAAC (OB.DAAC)