Data from NASA’s Physical Oceanography DAAC (PO.DAAC) are among the datasets included in COVERAGE’s offerings. However, “COVERAGE deals with interagency datasets, not just NASA data, and focuses on providing what the research community considers to be high-value data products useful for a wide range of end-user applications,” said Tsontos. Therefore, COVERAGE datasets do not include lower-level data (e.g., Level 1 and 2) that a science team might use. Rather, they are the more processed, higher-level (e.g., Level 3 and 4) gridded, merged, and multi-instrument datasets from NASA and its international partners. These higher-level data sets target the applications and research communities, as well as decision makers.
“We absolutely don’t want to provide everything because that’s one of the challenges that less experienced data users face, ‘Which product should I select?’” Tsontos said. “Based on expert and community inputs, we have curated a set of fit-for-purpose data products for them in COVERAGE.”
In instances where Level 4 datasets for ocean parameters are found to be lacking, the COVERAGE project team has pursued their own development. Currently, the COVERAGE project is developing and validating a gap-free, multi-mission, high resolution Level 4 chlorophyll-A ocean color dataset, which is a critical product for assessing the condition and productivity of the ocean.
In addition to pulling together the most widely used datasets for each of the four ocean science parameters, COVERAGE also makes it easier for less experienced Earth science data users to not only find but get the data they want.
“COVERAGE is also trying to reduce the technical barriers to accessing data,” said Tsontos. “The mechanics of getting data from different agency repositories varies considerably, so there is a complex, heterogeneous landscape of data acquisition that users currently have to navigate. They have to become familiar with different systems and tools that are supported by the different archives to get what they want once they’ve actually figured out and found what they want. This is time consuming and detracts focus from the science problem that needs to be addressed.”
COVERAGE is doing that, says Tsontos, by “providing a more consistent and user-friendly interface that hides the mechanics.”
COVERAGE is being developed in phases. The COVERAGE initiative was first proposed and then discussed within CEOS prior to approval in 2017. The roughly nine-month Phase-A activity involved requirements gathering based on stakeholder consultations, designing the system’s architecture, reviewing, and deciding upon constituent data products and defining a thematic application used to demonstrate the system’s capabilities. Phase B of the project—prototype development—began in late 2019 and concluded in December of 2020. Phase C implementation started in June 2021. During this installment, the COVERAGE team plans to extend the prototype to an operations-grade capability with additional functionality that provides an enhanced the user experience.
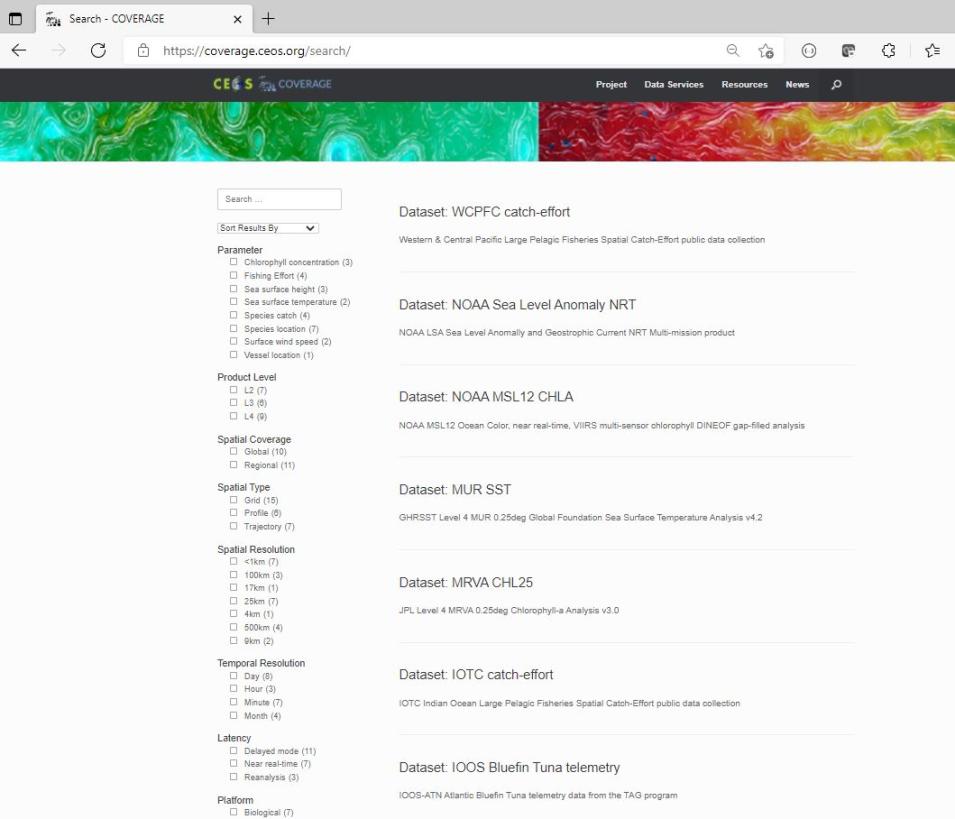
However, users need not wait until the conclusion of Phase C to experience COVERAGE. They can explore the platform at https://coverage.ceos.org/ and experience its data search, visualization, and analytics services now. For example, clicking on the Search link (under the Data Services heading in the top-level navigation) brings users to the interface that allows them to choose from a list of parameters and ultimately zero-in on the dataset that best meets their needs. The interface also offers the data product metadata directly from its source, be it PO.DAAC, Copernicus, or another data center. Once a dataset is selected, users are provided with a description, along with links to supporting documentation, data service endpoints and links, and the location where the data are archived.
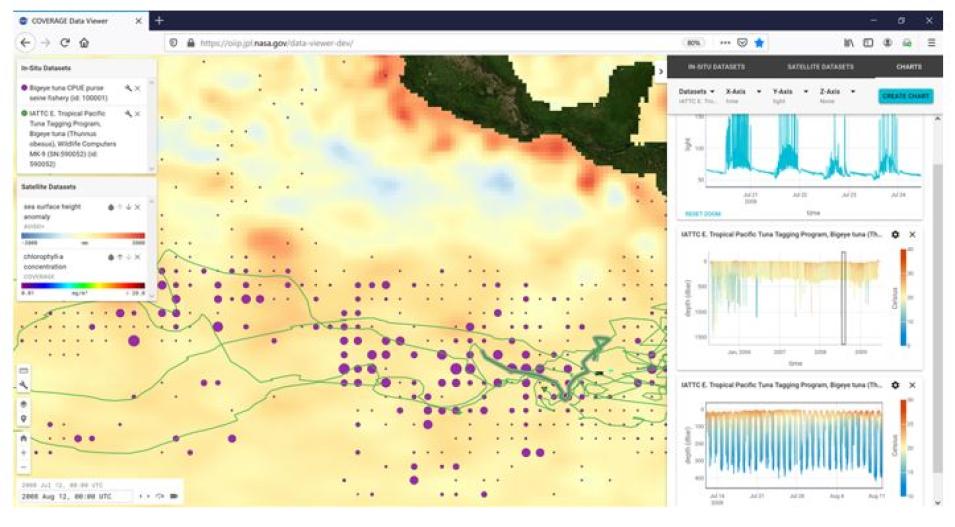
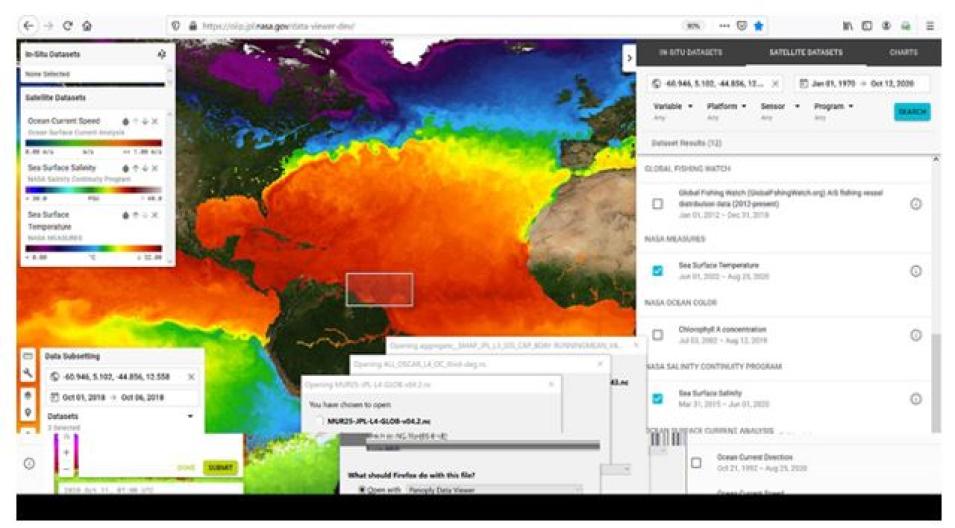
The Visualization link (also under the Data Services heading) brings users to the COVERAGE Data Viewer, which allows users to explore in-situ and satellite data separately or together. Users can also set up animations to observe dynamic changes and the evolution of data over time data both as maps and coupled plots that can be interactively defined and shared with colleagues.


