Meet EMIT, the Newest Imaging Spectrometer

Data from the EMIT instrument help scientists better understand the role mineral dust plays in heating and cooling the atmosphere.

It might be hard to believe that something so small can have such a big impact, but it’s true: mineral dust from the world’s dry and desert regions has a significant impact on Earth’s climate.

It all starts when wind lifts lightweight mineral particles from the planet’s arid regions high into the atmosphere, where they meet even faster winds that transport these particles around the globe. At these high altitudes, the suspended dust particles can heat or cool the surrounding air by absorbing or reflecting sunlight. However, without an understanding of the dust's mineral composition, it has been challenging for scientists to estimate its climate-associated impacts.

That could soon change thanks to data collected by NASA's Earth Surface Mineral Dust Source Investigation (EMIT) instrument, whose measurements are being used to determine surface mineralogy across Earth’s arid regions.

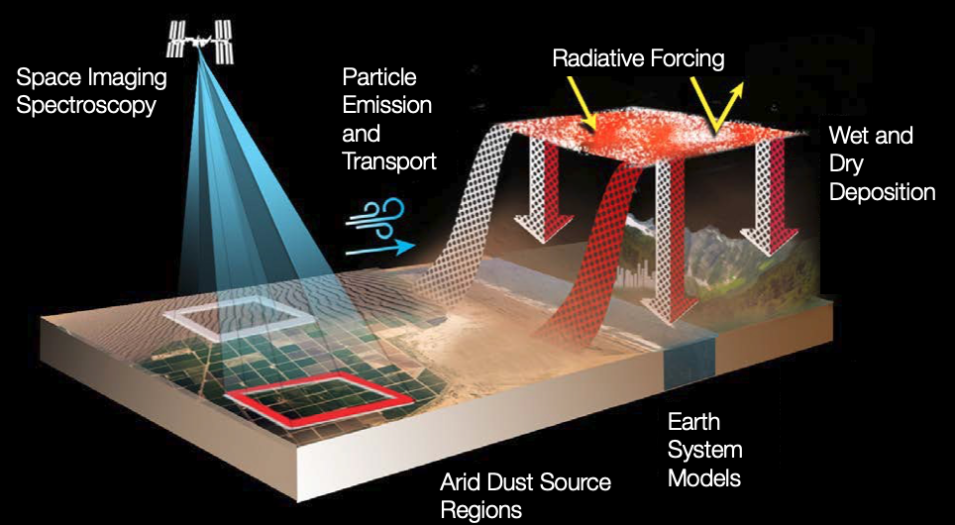
This graphic shows how airborne mineral dust particles can travel thousands of miles to affect the atmosphere above and the ecosystems on entirely different continents for where it was sourced.
Image Caption

When strong winds on one continent stir up mineral rock dust (such as calcite or chlorite), these airborne particles can travel thousands of miles to affect different continents. Suspended dust can heat or cool the atmosphere and Earth's surface. This heating or cooling effect is the focus of NASA’s Earth Surface Mineral Dust Source Investigation (EMIT) mission. EMIT data will enable scientists to create a new mineral map of Earth’s dust-producing regions, which will improve computer models that scientists can use to assess the regional and global heating and cooling effects of mineral dust. Credit: NASA/JPL-Caltech.

Launched on July 14, 2022, and installed on the International Space Station, EMIT is an imaging spectrometer that records visible to short-wave infrared (VSWIR) light reflected from Earth's surface. During its planned one-year mission, EMIT will collect data over Earth’s dust-source regions—namely, the arid regions of Africa, Asia, North and South America, and Australia—between 52° north and south latitude. With a viewing swath of 75 kilometers, 285 spectral bands, and a spatial resolution of 60 meters, the data EMIT collects will be used to produce mineral maps to determine the sources of dust in the atmosphere.

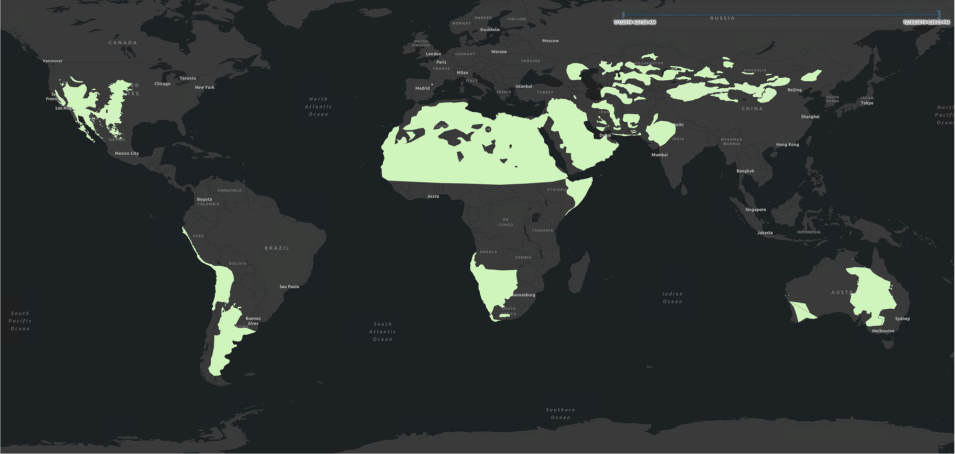
This highlighted areas on this map of the world indicate the places--the arid regions of Africa, Asia, North and South America, and Australia--that the EMIT instrument will focus on from its perch on the International Space Station.
Image Caption

The EMIT science team has developed and refined the target area for the current and potential future arid land dust source regions, and operations are focused on collecting data from the areas highlighted in green. EMIT has the capacity for multiple acquisitions over these areas to account for possible cloud interference or poor observation conditions. Credit: NASA/JPL-Caltech.

According to Dr. Robert Green, principal investigator on the EMIT mission, these data will help researchers better understand the compositional makeup of dust particles on the ground and the role they play in heating and cooling Earth’s atmosphere and surface once they become airborne.

“Currently, when we model dust in the Earth system, we rely on only 5,000 measurements around the planet where we know the mineral make-up of those locations,” Green said in a NASA Jet Propulsion Laboratory (JPL) YouTube video about the mission. “With EMIT’s imaging spectrometer, we can take that from 5,000 measurements to one billion over [Earth’s] arid lands and really improve our ability to understand radiative forcing and the other effects of mineral dust in the Earth system.”

This image shows the first measurements taken by EMIT on July 27, 2022, as it passed over Western Australia. The front image shows a mix of materials, including exposed soil (brown), vegetation (dark green), agricultural fields (light green), a small river, and clouds. The rainbow colors extending behind the front image are the spectral fingerprints in different colors from corresponding spots within it.
Image Caption

This image shows the first measurements taken by EMIT on July 27, 2022, as it passed over Western Australia. The image at the front of the cube shows a mix of materials in Western Australia, including exposed soil (brown), vegetation (dark green), agricultural fields (light green), a small river, and clouds. The rainbow colors extending through the main part of the cube are the spectral fingerprints from corresponding spots in the front image. Credit: NASA/JPL-Caltech.

Although investigating the role airborne mineral dust plays in heating or cooling Earth is the focus of the mission, its second objective is to improve scientists’ understanding of how the planet's dust cycle may change under different climate projection scenarios.

“EMIT is designed to help us answer several important questions: What is [mineral] dust made of? What kind of particles are being blown into the atmosphere? Are they light particles, dark particles, more acidic particles, more basic particles, and how will they interact with the Earth system?” Green said. “Will there be more regions of mineral dust or fewer regions, and how will that effect the climate in the future?”

The answers to such questions are significant, as they are relevant to a range of scientific disciplines.

“When there are high winds blowing across arid lands, dust is emitted into the atmosphere where it starts to interact with the Earth system,” said Green. “It immediately changes the chemistry of the atmosphere. It can play a role in how clouds are formed, and the mineral particles can scatter light back into space or they can absorb light if they're dark and heat Earth. Then, when they're deposited in terrestrial ecosystems, they can provide phytonutrients, as they do in the Brazilian rainforest. When they land in the ocean they provide nutrients for marine ecosystems and when they land on snow they can change how snow melts, which impacts water resources.”

In addition to detailing the makeup of atmospheric dust, EMIT has demonstrated another crucial capability: detecting the presence of carbon dioxide and methane super emitters. Super emitters are facilities, equipment, and other infrastructure, typically in the fossil fuel, waste, or agriculture sectors, that release high concentrations of methane. With less than a year’s worth of data, the EMIT science team has identified more than 50 such super emitters in Central Asia, the Middle East, and the Southwestern United States.

“These results are exceptional, and they demonstrate the value of pairing global-scale perspective with the resolution required to identify methane point sources, down to the facility scale,” said Dr. David Thompson, the EMIT instrument scientist and a senior research scientist at JPL. “It’s a unique capability that will raise the bar on efforts to attribute methane sources and mitigate emissions from human activities.”
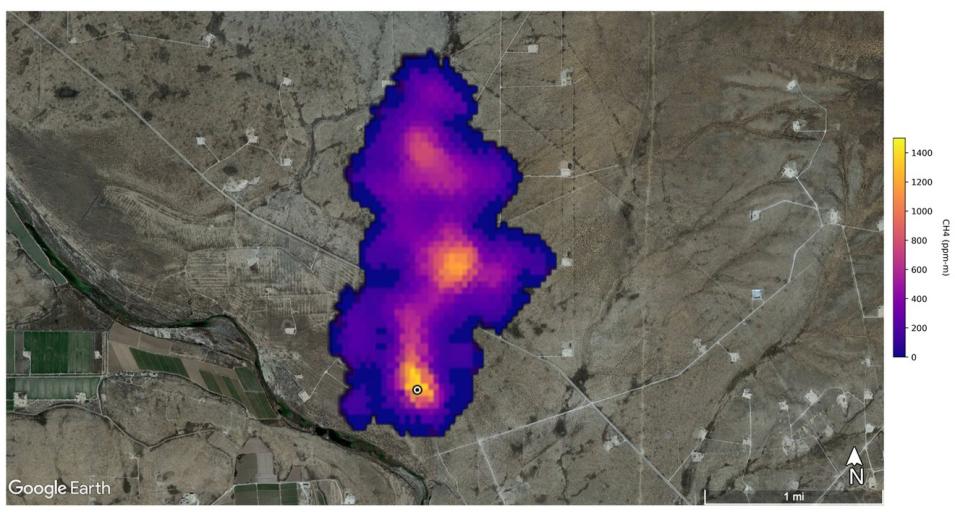
The purple area in this image indicates the presence of a methane plume 2 miles (3 kilometers) long that NASA’s Earth Surface Mineral Dust Source Investigation mission detected southeast of Carlsbad, New Mexico.
Image Caption

This image shows a methane (CH4) plume 2 miles (3 kilometers) long that EMIT detected southeast of Carlsbad, New Mexico. Orange and red colors indicate higher concentrations of methane. Credit: NASA/JPL-Caltech.

EMIT data are distributed by NASA’s Land Processes Distributed Active Archive Center (LP DAAC). The LP DAAC and the EMIT science team are working together to make sure the EMIT mission and data are closely aligned with NASA’s open science priorities. The EMIT Science Data System algorithms used for data processing routines are fully open to the public through GitHub. This enables scientists outside the core mission science team to directly evaluate and interact with the algorithms used to process the raw data retrieved by EMIT into distributable data products.

Enhancing these open science efforts, the EMIT science team built an open data portal called the VSWIR Imaging Spectroscopy Interface for Open Science (VISIONS) that allows anyone to see where and when EMIT will collect data. This information allows scientists to plan and execute field campaigns synchronously with the overpass of the International Space Station and see where EMIT data intersect with other datasets. Such information is crucial to evaluating the quality of on-going mission products and it enables the broader scientific community to conduct novel research. Finally, scientists at LP DAAC have developed Python scripts and resources to help people get started using EMIT data. These are available on GitHub at the EMIT-Data-Resources Repository and are open for public contribution and use.

Product Overview

The EMIT Level 1B At-Sensor Calibrated Radiance and Geolocation (EMITL1BRAD; doi:10.5067/EMIT/EMITL1BRAD.001) Version 1 data product provides at-sensor calibrated radiance values along with observation data in a spatially raw, non-orthocorrected format. Each data granule consists of two Network Common Data Format 4 (NetCDF4) files that have a 60-meter spatial resolution:

  • The Radiance file contains the at-sensor radiance measurements of 285 bands with a spectral range of 381 to 2,493 nanometers (nm) and with a spectral resolution of ~7.5 nm, which are held within a single science dataset layer
  • The Observation file contains viewing and solar geometries, timing, topographic, and other information related to the observation

The EMIT Level 2A Estimated Surface Reflectance and Uncertainty and Masks (EMITL2ARFL; doi:10.5067/EMIT/EMITL2ARFL.001) Version 1 data product provides surface reflectance data in a spatially raw, non-orthocorrected format. Each data granule consists of three NetCDF4 files that have a 60-meter spatial resolution:

  • The Reflectance file contains surface reflectance maps of 285 bands with a spectral range of 381 to 2,493 nm at a spectral resolution of ~7.5 nm, which are held within a single science dataset layer
  • The Reflectance Uncertainty file contains uncertainty estimates about the reflectance captured as per-pixel, per-band, posterior standard deviations
  • The Reflectance Mask file contains six binary flag bands and two data bands. The binary flag bands identify the presence of features that indicate if a pixel should be excluded from analysis. The data bands contain estimates of aerosol optical depth (AOD) and water vapor

The NetCDF4 files for both products hold location groups containing geometric lookup tables (GLT), which are orthorectified images that provide relative x and y reference locations from the raw scene to allow for projection of the data. Along with the GLT layers, the files also contain latitude, longitude, and elevation layers. The latitude and longitude coordinates are presented using the World Geodetic System (WGS84) ellipsoid. The elevation data were obtained from Shuttle Radar Topography Mission v3 (SRTM v3) data and resampled to EMIT’s spatial resolution.

By the end of the EMIT mission, EMIT data products will be offered at four levels of data processing: Level 1B, Level 2A, Level 2B, Level 3, and Level 4. (Note: Level 4 data products will be generated late in the EMIT mission lifecycle.)

Data Access and Additional Resources

Users can access and download EMIT data products from NASA Earthdata Search.

Along with the links noted above, additional EMIT resources include:

Details

Last Updated

Published

Data Center/Project

Land Processes DAAC (LP DAAC)