Data Tool in Focus: TESViS

Terrestrial Ecology Subsetting and Visualization Services (TESViS) supports ecological field research in easy-to-use formats.

Earth science data from satellites and other space-based instruments, such as the Moderate Resolution Imaging Spectroradiometer (MODIS), Visible Infrared Imaging Radiometer Suite (VIIRS), and Global Ecosystem Dynamics Investigation (GEDI), and products from models, such as Daymet, are valuable resources for research in terrestrial ecology. However, the sheer scale of these data products in terms of spatial resolution, temporal frequency, and data volume means that data users must spend a significant amount of time and effort retrieving and processing data before the data can be used for analysis. In addition, the complexity of these data products, including diverse data structure, complex data quality information, and differing file formats, also may be impediments for less experienced data users.

To address these challenges, NASA’s Oak Ridge National Laboratory Distributed Active Archive Center (ORNL DAAC) developed the Terrestrial Ecology Subsetting and Visualization Services (TESViS, formerly known as the MODIS/VIIRS Subsets Tool). TESViS is a suite of integrated, standards-compliant tools and services designed to simplify the process of working with satellite and model-produced data products. It simplifies the download, transformation, visualization, aggregation, and analysis of large datasets and reduces technological barriers for scientists new to working with remotely sensed data.

“TESViS frees users from having to worry about the formats data products come in, some of which can be hard for non-technical users to work with,” said Dr. Rupesh Shrestha, an ORNL DAAC research staff member. “TESViS gives them the data they need in the format they’re comfortable with. This makes the data more accessible and helps users get quickly started toward developing and eventually expanding their scientific workflows.”

TESViS gives users three options for subsetting a range of NASA’s Earth observation data products at useful scales and provides the subsets in easy-to-use formats.

The Global Subsets Tool allows users to request a subset for any location (or locations) on Earth by pinpointing the area on a map or entering its geographic coordinates into the tool’s interface. The size of selected areas may range from a pixel (sub-kilometer) to areas of 201 x 201 km. User requests via the Global Subsets Tool require a wait time for the tool to process, which is usually less than 30 minutes.

When complete, users receive an email containing a URL where they can download the data subset and access interactive visualizations, time series plots of the data, an ASCII file of the pixel values for the selected product (values include quality information and statistics of the subset data for the area), and GeoTiff files that can be imported directly into GIS software. Along with the subset data, the Global Subsets Tool also provides complementary information, such as land cover grid and phenology of the area and an estimate of heterogeneity.
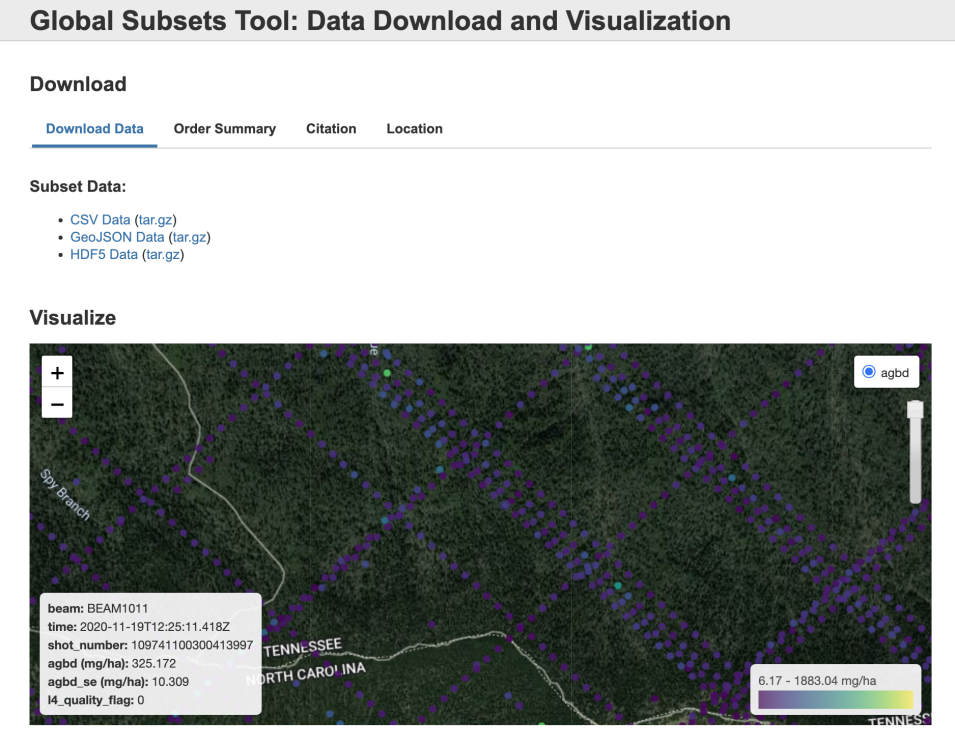
screenshot with text on top and image at bottom; image is green with lavender dots indicating sensing points; image key is in lower left corner
Image Caption

This TESViS Global Subsets Tool visualization shows the footprints (purple/blue/green dots) in a subset of GEDI aboveground biomass density (Level 4A) data for an 11 km x 11 km area around Clingmans Dome in Great Smokey Mountains National Park, Tennessee, USA. The GEDI footprint data are for the period of May 2019 to May 2021. Credit: NASA's ORNL DAAC.

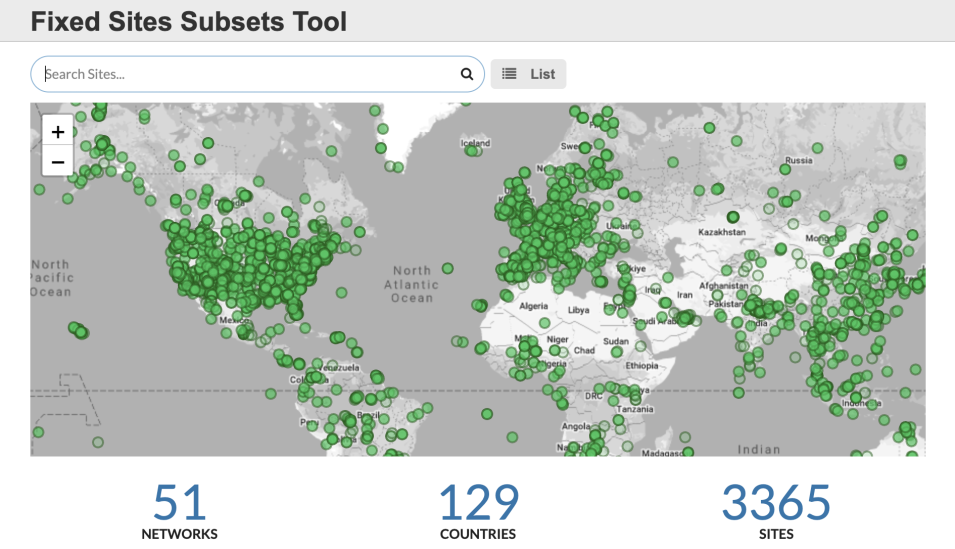
The Fixed Sites Subsets Tool provides downloads of pre-processed subsets for more than 3,000 field and flux tower sites for the validation of models and remote sensing products. The goal of the Fixed Sites Subsets Tool is to provide instant summaries of selected data products for the terrestrial ecology community to use in characterizing field sites. Data products are subset to 8 x 8 km and reformatted from their native formats to ASCII and JSON files. These ASCII files grow as new data are acquired and processed.

global map with sites indicated by green dots; metrics along bottom indicate number of sites
Image Caption

The TESViS Fixed Sites Subsets Tool provides customized subsets and visualizations of several MODIS/VIIRS land products and Daymet daily surface weather data for selected field and flux tower sites around the world (indicated by green dots). Spatial subsets of the land products are available for predefined areas of about 8 x 8 km centered on the selected sites. Site-specific data can be downloaded in both comma separated value (.csv) and JSON formats. Credit: NASA's ORNL DAAC.

The TESViS web service application programming interface (API) retrieves subset data in real-time for any location(s), time period, and area programmatically using a Representational State Transfer (REST) web service. Web service clients and libraries are available in multiple programming languages, such as Python and R, allowing integration of subsets into users' workflow. Through the web service, users can submit simple HTTP requests to an API endpoint (the location of a resource on the API) to retrieve the subsets on their individual workstations.

In addition to subsetting, TESViS enables users to:

  • Filter subset requests via user-defined criteria, including data product, sensor, and variable
  • Employ recommended quality filters using data quality flags
  • Reformat subset results into ASCII plain text, JSON, Shapefile, or GeoTIFFs
  • Reproject subset results to MODIS sinusoidal projection or geographic latitude and longitude coordinates to facilitate data integration
  • Visualize subset data as interactive maps and time series plots that users can incorporate into research presentations, posters, and similar products

Ongoing Evolution

TESViS, originally the MODIS/VIIRS Subsets tool (a name that still appears on the ORNL DAAC website), was created in 2003 to reduce impediments to the use of MODIS data, such as manipulating data in HDF format, working with the Sinusoidal Tile Grid used by standard MODIS land products, and addressing data quality flags (i.e., issues pertaining to the confidence or quality of the data retrieved), by non-technical data users. The tool originally offered users select, preprocessed subsets of MODIS data for 169 Fluxnet sites.

Since then, TESViS has continued to facilitate the use and analysis of remotely sensed data for non-technical users and has evolved to accommodate several new types of data beyond MODIS and VIIRS. Among the datasets TESViS works with are those from the Soil Moisture Active Passive (SMAP) and Ice, Cloud, and land Elevation Satellite-2 (ICESat-2) missions; the ECOsystem Spaceborne Thermal Radiometer Experiment on Space Station (ECOSTRESS) and GEDI instruments on the International Space Station; the NASA Jet Propulsion Laboratory’s Solar Induced Fluorescence (SIF) Project; and ORNL DAAC’s Daymet.

It was this expansion in the number and type of datasets the tool can accommodate that prompted the ORNL DAAC to change the tool's name.

“We started with the MODIS subsets in 2003 and then we added VIIRS continuity products in 2018. More recently, we added products from other sensors, such as GEDI, SMAP, and ICESat-2,” said Shrestha. “Just having MODIS and VIIRS in the name didn’t make sense. We wanted to make the tool’s name representative of the subsetting and visualization services it provides.”

Additional datasets will be added to TESViS in the near future, including those from the upcoming NASA/Indian Space Research Organization Synthetic Aperture Radar mission (NISAR; scheduled for launch in 2024) and other NASA missions and projects relevant to terrestrial ecology.

“Our goal is to make TESViS as useful to ecologists as possible given our available resources,” Shrestha said. “NISAR is a synthetic aperture radar, SAR, that can penetrate clouds and tree canopy. It will provide global-scale information on canopy structure and aboveground biomass, which would be useful to characterize ecosystems and understand their response to disturbances and [the] changing climate.”

NASA’s efforts to move more of its data holdings to the cloud will impact the TESViS evolution, too, as hosting more data in the cloud will facilitate ORNL DAAC’s efforts to expand the number of datasets TESViS can accommodate, helping it to keep pace with the ever-evolving needs of users.

Then again, TESViS has a long history of doing just that. Since its creation, TESViS has been consistently ranked as one of NASA’s most used data tools and cited by researchers more than 700 times in peer-reviewed publications. Its popularity was instrumental in the ORNL DAAC's MODIS Team receiving the Federal Geographic Data Committee’s 2016 Doug D. Nebert National Spatial Data Infrastructure (NSDI) Champion of the Year Award, which “recognizes an individual or a team in the U.S. that has developed an outstanding, innovative, and operational tool, application, or service capability used by multiple organizations that furthers the vision of the NSDI.”

Learning Resources

For more information on using TESViS, see the following webinars and tutorials:

Details

Last Updated

Published

Data Center/Project

Oak Ridge National Laboratory DAAC (ORNL DAAC)