Around this time, Hsu said, the Chinese government announced that it had been collecting PM2.5 data all along but had not seen the need to release it and that PM2.5 concentrations in China had actually decreased over the last ten years. “None of the data have been transparent,” Hsu said. “So none of the citizens believed it. That was a big lesson for the Chinese government; transparency is absolutely essential for effective environmental management and communication.”
A wind shift
Finally, in January 2013, China began publishing PM2.5 air quality ratings for seventy-four of its cities. “It looks pretty consistent with how you would expect air quality to be in these cities—a lot of them are showing very severe PM2.5 pollution,” Hsu said. China has also started to address some sources of pollution. A month after publishing PM2.5 data, the government announced a plan to curb emissions with a ban on sub-standard diesel-fueled vehicles.
Chinese citizens continue to be passionate about improving the air they breathe and compulsively check both official Chinese air quality readings and those tweeted by the U.S. Embassy in Beijing. On January 12, 2013, netizens noted that AQI readings at the U.S. Embassy in Beijing reached a staggering 755. The government did not publish the actual value, but only noted that it was “Beyond Index.”
Hsu says it is a great start. She said, “Scientists say that if you start releasing PM2.5 data today, citizens will have a better idea of the dangers and the extent of the pollution that they are facing. Still, experts in China say it will take about twenty to thirty years to clean up the air in Beijing.”
References
Battelle Memorial Institute and Center for International Earth Science Information Network (CIESIN)/Columbia University. 2013. Global Annual Average PM2.5 Grids from MODIS and MISR Aerosol Optical Depth (AOD). Palisades, New York USA: NASA Socioeconomic Data and Applications Center (SEDAC).
Center for International Earth Science Information Network (CIESIN)/Columbia University, International Food Policy Research Institute (IFPRI), The World Bank, and Centro Internacional de Agricultura Tropical (CIAT). 2011. Global Rural-Urban Mapping Project, Version 1 (GRUMPv1): Population Count Grid. Palisades, New York USA: NASA Socioeconomic Data and Applications Center (SEDAC).
Hsu, A., A. de Sherbinin, and H. Shi. 2012. Seeking truth from facts: the challenge of environmental indicator development in China. Environmental Development 3: 39–51.
Kahn, R., J. Martonchik, D. Diner, M. Garay, and M. Bull. 2009. MISR Level 2 Aerosol. Hampton, Virginia USA: NASA Atmospheric Science Data Center (ASDC).
Levy, R. C., L. A. Remer, D. Tanré, S. Mattoo, and Y. J. Kaufman. 2006. Updated 2009. MODIS Level 2 Aerosol. Greenbelt, Maryland USA: NASA Level 1 and Atmosphere Archive and Distribution System (LAADS) Distributed Active Archive Center (DAAC).
van Donkelaar, A., R. V. Martin, M. Brauer, R. Kahn, R. Levy, C. Verduzco, and P. J. Villeneuve. 2010. Global estimates of exposure to fine particulate matter concentrations from satellite-based aerosol optical depth. Environmental Health Perspectives 118(6): 847–588, doi:10.1289/ehp.0901623
For more information
NASA Socioeconomic Data and Applications Center (SEDAC)
NASA Level 1 and Atmosphere Archive and Distribution System Distributed Active Archive Center (LAADS DAAC)
NASA Atmospheric Science Data Center (ASDC)
NASA Land, Atmosphere Near real-time Capability for EOS (LANCE)
Moderate Resolution Imaging Spectroradiometer (MODIS)
Environmental Performance Index
| About the data used |
|---|
| Satellites | | Terra | Terra |
| Sensors | | Moderate Resolution Imaging Spectroradiometer (MODIS) | Multi-angle Imaging Spectroradiometer (MISR) |
| Data sets | Global Rural-Urban Mapping Project, version 1 (GRUMPv1) | MODIS Level 2 Aerosol | MISR Level 2 Aerosol |
| Resolution | 30 arc-seconds, latitude/longitude | 10 kilometer | 16 x 16 array of 1.1 kilometer radiance pixels |
| Parameters | Human population density | Aerosol optical depth | Aerosol optical depth |
| DAACs | NASA Socioeconomic Data and Applications Center (SEDAC) | NASA Level 1 and Atmosphere Archive and Distribution System Distributed Active Archive Center (LAADS DAAC) | NASA Atmospheric Science Data Center (ASDC) |
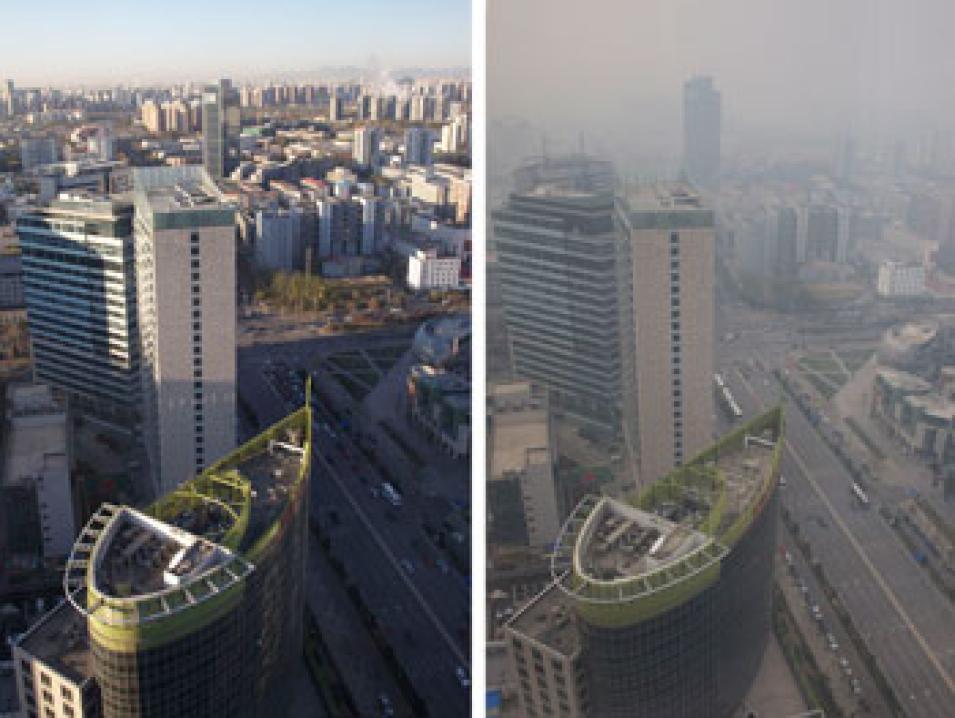
The photograph in the title graphic shows fog and smog blanketing Beijing in January 2013. (Courtesy T. K. Hjorth)


