Earth Science Data Roundup: November 2024

A summary of datasets, products, and resources released by NASA’s Distributed Active Archive Centers (DAACs) in October 2024.

Atmospheric Science Data Center (ASDC)

PREFIRE Level 0 Data Now Available

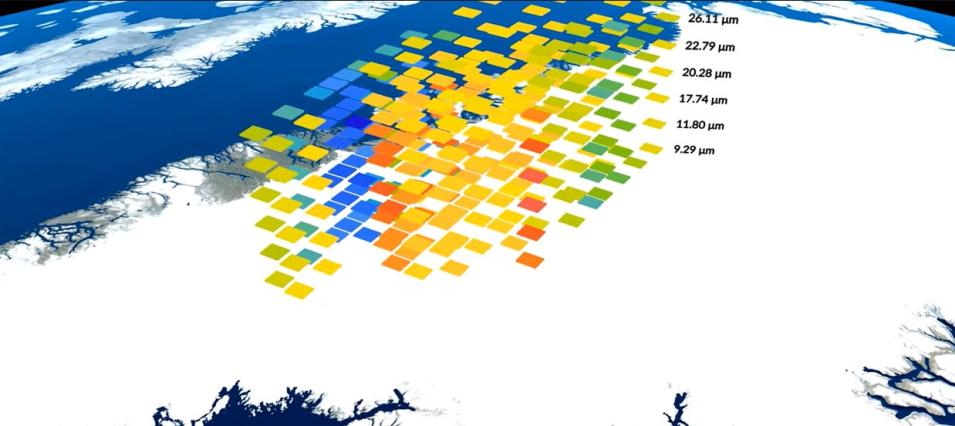
NASA's ASDC released several Level 0 datasets from the Polar Radiant Energy in the Far-InfraRed Experiment (PREFIRE). PREFIRE aims to improve our understanding of how the Arctic is responding to and influencing climate change by acquiring measurements in the far-infrared part of the electromagnetic spectrum. PREFIRE Level 0 data products consist of raw text-format information about the status of each PREFIRE cube satellite (CubeSat) in orbit along with raw binary-format engineering, calibration, and Earth-observation data from each CubeSat science instrument payload.

Access PREFIRE data and more information

This visualization shows brightness temperature data -- the intensity of infrared emissions -- over Greenland. Here, the data area presented as different colored squares, over a map of Greenland. The data are from one of the two CubeSats in the PREFIRE mission. Red represents more intense emissions; blue indicates lower intensities.
Image Caption

PREFIRE comprises two space-based Thermal InfraRed Spectrometers (TIRS) aboard two small 6U cube satellites (CubeSats). Data from one of these two CubeSats were used to make this data visualization showing brightness temperature—the intensity of infrared emissions—over Greenland. Red represents more intense emissions; blue indicates lower intensities. Credit: NASA's Scientific Visualization Studio.

Global Hydrometeorology Resource Center Distributed Active Archive Center (GHRC DAAC)

IMPACTS Diode Laser Hygrometer Dataset Released

NASA's GHRC DAAC released the Diode Laser Hygrometer (DLH) dataset from the Investigation of Microphysics and Precipitation for Atlantic Coast-Threatening Snowstorms (IMPACTS) Earth Venture Suborbital 3 project. 

The dataset comprises water vapor mixing ratio measurements and relative humidities (both liquid water and ice) provided by the Turbulent Air Motion Measurement System (TAMMS) instrument suite. The DLH data files are available for flights occurring January 13, 2023, through February 28, 2023, and are in ASCII format.

IMPACTS was a three-year sequence of winter season deployments conducted to study snowstorms over the U.S. Atlantic Coast (2020-2023). The project aimed to provide observations critical to understanding the mechanisms of snowband formation, organization, and evolution; examine how the microphysical characteristics and likely growth mechanisms of snow particles vary across snowbands; and improve snowfall remote sensing interpretation and modeling to advance prediction capabilities significantly. 

Access the IMPACTS DLH dataset and more information

IMPACTS ACHIEVE W-Band Cloud Radar Dataset Now Available

The IMPACTS Aerosol, Cloud, Humidity, Interactions Exploring and Validating Enterprise (ACHIEVE) W-Band Cloud Radar dataset consists of measured reflectivity, signal-to-noise ratio, and radial velocity data. ACHIEVE W-Band Cloud Radar data are available from January 23, 2023, through March 1, 2023, in netCDF4 format.

Access IMPACTS ACHIEVE dataset and more information

IMPACTS Lightning Instrument Package Version 2 Dataset Released 

The Lightning Instrument Package (LIP) dataset consists of electrical field measurements of lightning and navigation data collected by the LIP flown on NASA's ER-2 aircraft during the IMPACTS field campaign. Version 2 LIP data have been filtered to remove the field mill offsets (i.e., offsets associated with the sensors of the Kennedy Space Center Advanced Ground Based Field Mill network) that were identified in the Version 1 data. These new data are available from January 15, 2020, through March 2, 2023, and are in ASCII format. 

Access IMPACTS LIP Version 2 data and more information

IMPACTS Millersville University Upper Air Radiosondes Version 1 Dataset Now Available

The Millersville University Upper Air Radiosondes dataset contains atmospheric temperature, dew point temperature, wind speed, and wind direction measurements from the Vaisala’s Radiosonde RS41-SGP and Sparv Embedded S1H3 Windsond used during the IMPACTS field campaign. Data are available from January 16, 2022, through February 28, 2023, in ASCII format. 

Access IMPACTS Millersville Upper Air Radiosone data and more information

Goddard Earth Sciences Data and Information Services Center (GES DISC)

Release of OMPS-NOAA-21 Radiances Dataset

NASA's GES DISC released the Ozone Mapping and Profiler Suite (OMPS) NOAA-21 Level 1G Limb Profiler (LP) Radiance EV Wavelength-Altitude Grid Swath Orbital 3slit Version 1.0 dataset, which provides calibrated, Earth-viewing radiances measured by the OMPS LP instrument aboard the NOAA-21 platform. The LP Level 1G product measures radiances in the wavelength region from 280 to 1000 nanometers. The data are in HDF5 format.

Access OMPS LP data and more information

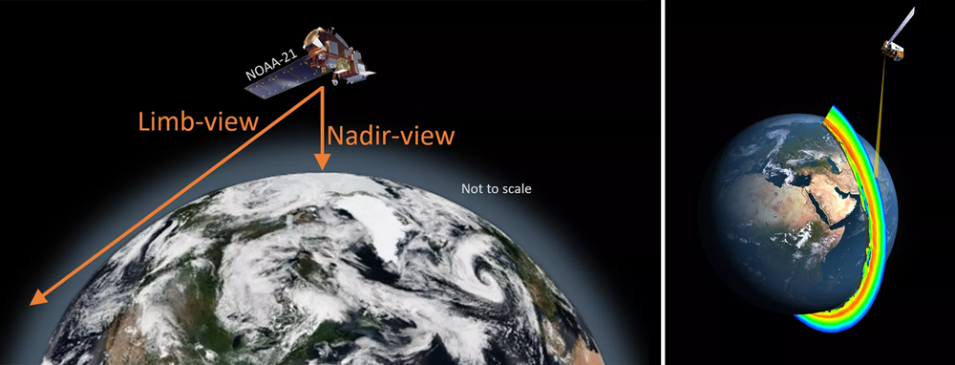
These side-by-side graphics show the two ways the Ozone Mapping and Profiler Suite (OMPS) instrument aboard NOAA-21 observes Earth's atmosphere. The graphic on the left shows its nadir (straight down) and limb viewing (diagonal) perspectives. The graphic on the right shows a cross-section of the Earth's ozone layer as measured by the OMPS Limb Profiler.
Image Caption

Left image: Rendering of OMPS aboard NOAA-21 showing its nadir and limb viewing perspectives. OMPS has two nadir-viewing spectrometers (Nadir Mapper and Nadir Profiler) that point straight down at Earth and measure total ozone through the entire atmospheric column, from top to bottom. The OMPS instrument aboard NOAA-21 also has a limb-viewing spectrometer (Limb Profiler) that looks diagonally through an atmospheric halo known as Earth’s limb. Right image: Cross-section of Earth's ozone layer as measured by the OMPS Limb Profiler aboard the Suomi National Polar-orbiting Partnership (Suomi NPP) platform. Blue colors indicate smaller concentrations of atmospheric ozone; orange and yellow indicate larger concentrations. Credit: NASA.

New OMPS NOAA-21 Level 2 Ozone Dataset

The OMPS NOAA-21 Level 2 LP Ozone (O3) Vertical Profile swath daily 3slit collection dataset provides measurements of the vertical distribution of ozone in the stratosphere and lower mesosphere. The data are available in HDF5 format.

Access the new OMPS NOAA-21 daily 3slit dataset and more information

Land Processes DAAC (LP DAAC)

EMIT Point Sample Visualizations Now Available in AppEEARS

Version 3.64 of the Application for Extracting and Exploring Analysis Ready Samples (AppEEARS) is now available through NASA's LP DAAC. This release adds a “Spectral Comparison” tab allowing visualization of point samples from the Earth Surface Mineral Dust Source Investigation (EMIT) mission. The Spectral Comparison tab enables users to compare extracted point sample spectra from the EMIT Level 1B At-Sensor Calibrated Radiance and Geolocation Data or EMIT Level 2A Estimated Surface Reflectance and Uncertainty and Masks products. Up to three spectra can be selected based on their unique point ID and date/time using a dropdown menu, then compared in an interactive spectral plot. 

More information about AppEEARS and the Spectral Comparison tab

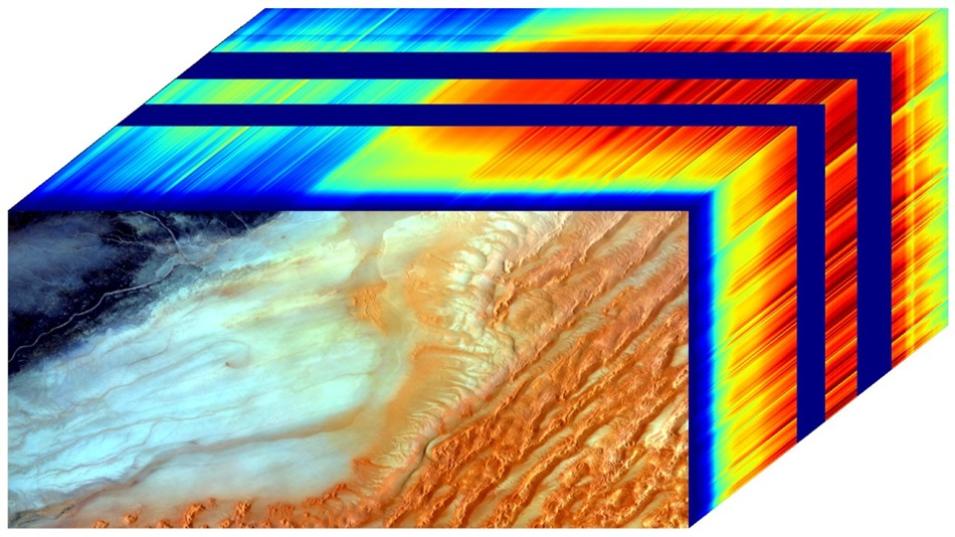
This EMIT image shows At-Sensor Calibrated Radiance RGB  (bands 36, 22, 10) and data cube showcasing spectral signatures of the data from the EMITL1BRAD product over Libya, Africa on August 17, 2022.
Image Caption

This EMIT image shows At-Sensor Calibrated Radiance RGB (bands 36, 22, 10) and a data cube showcasing spectral signatures of the data (colored areas behind the main front image) from the EMITL1BRAD product over Libya, Africa, on August 17, 2022. Credit: EMIT.

VIIRS/Suomi NPP Burned Area Dataset Released

NASA's LP DAAC released the monthly Visible Infrared Imaging Radiometer Suite (VIIRS)/Suomi NPP monthly, global gridded 500-meter (m) Burned Area Version 1 data product containing per-pixel burned area and quality information. The data product, which covers the mission period from March 2012 to the present, is designed after the combined Terra and Aqua Moderate Resolution Imaging Spectroradiometer (MODIS) burned area product to promote the the continuity of imagery from MODIS and VIIRS.

Access VIIRS/Suomi NPP Burned Area Monthly product and more information

Level 1 and Atmosphere Archive and Distribution System DAAC (LAADS DAAC)

NOAA-21 VIIRS Cloud Mask and Spectral Test Results Data Product Released

NASA's LAADS DAAC released the VIIRS/NOAA-21 Cloud Mask and Spectral Test Results 6-Minute Level 2 Swath 750-meter data product. This new VIIRS dataset is the latest in a series of products designed to facilitate continuity in cloud detection between the MODIS instruments aboard NASA's Aqua and Terra platforms and the VIIRS instruments aboard the joint NASA-NOAA Suomi NPP, NOAA-20, and NOAA-21 platforms.

The  product is based on the MODIS-VIIRS Cloud Mask algorithm that uses observations from spectral channels available on both instruments, as well as a series of visible and infrared threshold and consistency tests to specify confidence that an unobstructed view of Earth's surface has been observed. In addition to cloud mask results, the product contains geolocation information, scan line start times, and various attribute data. The product record spans from February 10, 2023, through the present. Data are available in netCDF4 format.

Access the new NOAA-21 VIIRS product and more information

National Snow and Ice Data Center DAAC (NSIDC DAAC)

Two SnowEx Mores Creek Datasets Released

The SnowEx Mores Creek Summit (MCS) Airborne LiDAR Survey, Version 1 and SnowEx MCS Airborne LiDAR Survey Raw, Version 1 datasets contain digital terrain models, digital surface models, snow depth models, and canopy height models, as well as the corresponding raw point cloud data. Data were collected as part of a multi-year effort to monitor monthly snow distribution over a region of the Mores Creek Headwaters in the Boise Mountains of central Idaho. Temporal coverage spans from March 10, 2021, to April 18, 2024.

Access SnowEx Mores Creek data and more information 

SnowEx21 Prairie Station Digital Surface Models Dataset Now Available

The SnowEx21 Prairie Station Digital Surface Models from UAV-LiDAR, Version 1 and SnowEx21 Prairie Station Hourly Meteorological Data, Version 1 datasets contain digital surface models derived from unmanned aerial vehicle (UAV)-lidar and hourly meteorological data acquired during the SnowEx 2021 field campaign. Temporal coverage for the SnowEx21 Prairie Station Digital Surface Models from UAV-LiDAR, Version 1 dataset spans from January 15, 2021, to March 4, 2021; coverage for the SnowEx21 Prairie Station Hourly Meteorological Data, Version 1 data spans from November 12, 2020, to April 2, 2021.

Access SnowEx Prairie Station data and more information

Updated Polar Pathfinder Sea Ice Motion Vectors Dataset

The Polar Pathfinder Daily 25 km Equal-Area Scalable Earth (EASE)-Grid Sea Ice Motion Vectors, Version 4 dataset has been updated through December 31, 2023. This dataset provides daily and weekly sea ice motion vectors including browse images of weekly data. The source data used to generate the daily and weekly ice motion estimates are derived from the Advanced Very-High-Resolution Radiometer (AVHRR), Advanced Microwave Scanning Radiometer-Earth Observing System (AMSR-E), Scanning Multichannel Microwave Radiometer (SMMR), Special Sensor Microwave Imager and Special Sensor Microwave Imager/Sounder (SSMIS) instruments; International Arctic Buoy Program (IABP) buoys; and forecasts from the National Centers for Environmental Prediction/National Center for Atmospheric Research Reanalysis.

Access Polar Pathfinder dataset and more information

EASE-Grid Sea Ice Age Dataset Updated 

The EASE-Grid Sea Ice Age, Version 4 dataset has been updated through December 31, 2023. This dataset provides weekly estimates of sea ice age for the Arctic derived from remotely sensed sea ice motion and sea ice extent.

Access EASE-Grid Sea Ice Age data and more information

Updated LVIS Datasets

The Land, Vegetation, and Ice Sensor (LVIS) Facility Level 1B Geolocated Return Energy Waveforms, Version 1 and LVIS Facility Level 2 Geolocated Surface Elevation and Canopy Height Product, Version 1 datasets have been updated. In addition to adding new data from the April 21 and April 25, 2022, campaigns, the files from the April 19 and April 22, 2022, campaigns, originally processed in October 2022 (R2210), have been replaced by the recently processed files (R2408) that contain a vertical calibration adjustment. These datasets respectively contain geolocated return energy waveforms and geolocated surface elevation and canopy height measurements from NASA's LVIS Facility, an airborne, wide-swath imaging laser altimeter system flown over target areas to collect data on surface topography and 3D structure.

Access updated LVIS datasets and more information

New High Mountain Asia Dataset

The High Mountain Asia 2 Meter Digital Elevation Model, Surface Velocity, and Lagrangian Surface Mass Balance for Select Debris Covered Glaciers, Version 1, is now available from NASA's NSIDC DAAC. This dataset contains 2-meter resolution digital elevation models, surface velocities, surface mass balance (SMB) rates, and SMB uncertainties for six debris-covered glaciers in Nepal. Temporal coverage for the entire dataset is December 2012 through December 2017, with approximately 1- to 2-year coverage of any given glacier within the dataset. 

Access the new High Mountain Asia dataset and more information

Updated Surface Soil Moisture Product Dataset 

The Soil Moisture Active Passive (SMAP)-derived 1-kilometer (km) downscaled surface soil moisture product, Version 1 dataset has been updated through June 2024. This data product contains global daily 1-km resolution surface soil moisture obtained from the SMAP L-band radiometer and is available in GeoTIFF format. 

Access updated SMAP data product and more information

Oak Ridge National Laboratory DAAC (ORNL DAAC)

Geological Earth Mapping Experiment Spring 2024 MASTER Dataset Now Available

NASA’s ORNL DAAC released the Geological Earth Mapping Experiment (GEMx) Spring 2024 dataset from the MODIS/ASTER Airborne Simulator (MASTER) instrument. The GEMx research project used NASA's Airborne Visible/Infrared Imaging Spectrometer (AVIRIS), Hyperspectral Thermal Emission Spectrometer (HyTES), and MODIS/ASTER Airborne Simulator (MASTER) instruments to acquire measurements over arid and semi-arid regions of parts of California, Nevada, Arizona, and New Mexico. This dataset includes Level 1B data products collected during 26 flights aboard a NASA ER-2 aircraft over California, Oregon, Nevada, and Arizona between April 2, 2024, and June 24, 2024; data are available in HDF4 format. Also included in the dataset are flight path and spectral band information, instrument configuration, ancillary notes, summary information for each flight, and browse images derived from each Level 1B data file.

Access GEMx MASTER dataset and more information

Delta-X Vegetation Types Dataset Released

The AVIRIS-Next Generation (NG) Level 3 Derived Vegetation Types, Mississippi River Delta, Louisiana, dataset from the Delta-X campaign is now available. This dataset provides maps of vegetation types for the Atchafalaya and Terrebonne basins in coastal Louisiana, U.S., derived from NASA's Airborne Visible Infrared Imaging Spectrometer Next Generation (AVIRIS-NG) imagery acquired during the spring and fall of 2021. The data are provided in cloud optimized GeoTIFF (COG) format.

Access Delta-X AVIRIS-NG dataset and more information  

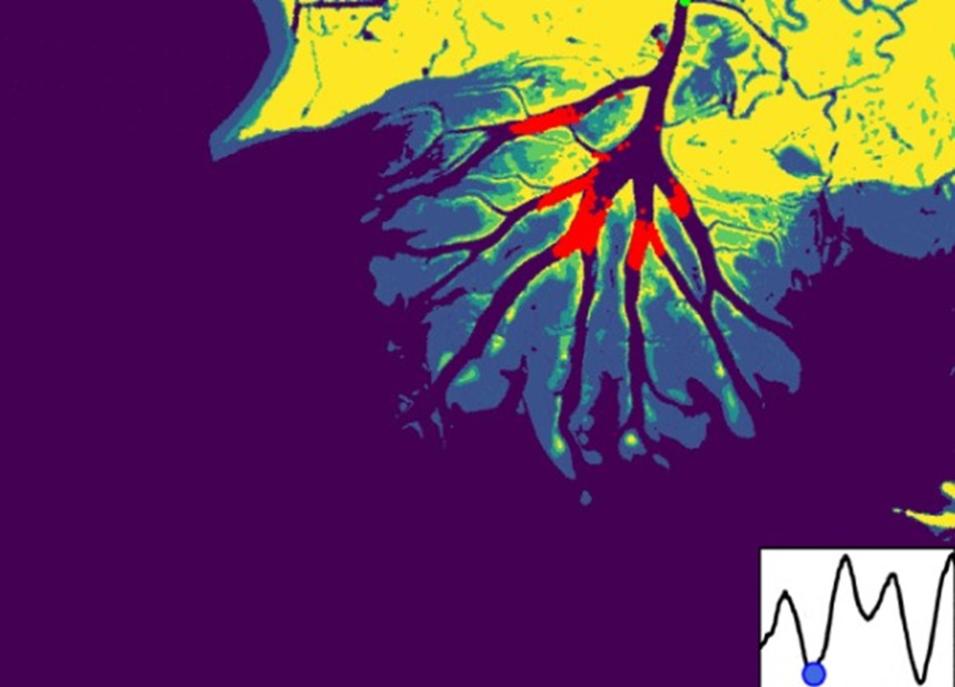
This graphic shows the location of sediment (in red) that will eventually move through the Wax Lake Delta, one of two places where the Atchafalaya River, a distributary of the Mississippi, flows into the Gulf of Mexico.
Image Caption

The Mississippi River Delta is growing and sinking in different areas. The airborne component of the Delta-X campaign collects large scale measurements to estimate water and sediment flows along with vegetation production. These measurements calibrate hydrological and ecological models that scientists use to understand and forecast land gain or loss in deltas. This graphic shows the location of sediment (in red) as it moves through the Wax Lake Delta, one of two places where the Atchafalaya River, a distributary of the Mississippi, flows into the Gulf of Mexico. Credit: Delta-X.

Now Available: Land Use and Land Cover Change Projection in the ABoVE Domain Dataset

The Land Use and Land Cover Change Projection in the Arctic Boreal Vulnerability Experiment (ABoVE) Domain dataset is now available. This dataset provides projections of land use and land cover (LULC) change within the ABoVE domain from 2015 to 2100, with a spatial resolution of 0.25 degrees. It includes LULC change under two Shared Socioeconomic Pathways (SSP126 and SSP585) derived from the Global Change Analysis Model (GCAM) at an annual scale. The data were generated by integrating regional LULC projections from GCAM with high-resolution MODIS land cover data and applying two alternative spatial downscaling models (Future Land Use Simulation [FLUS] and Demeter). Data are provided in netCDF format.

Access LULC Projection data and more information 

MODIS-Derived Annual Vegetation Resilience, 2000-2019 Dataset Released

The MODIS-derived Annual Vegetation Resilience, 2000-2019 dataset provides estimates of vegetation resilience in the ABoVE core domain at annual time steps from 2000 to 2019 at 300-meter spatial resolution. Vegetation resilience is defined as the recovery rate from deviations (due to climate perturbations or disturbances) to the equilibrium state. The mapped vegetation resilience was derived from Terra MODIS Enhanced Vegetation Index products across 175 ABoVE B grid tiles over the ABoVE core domain. The estimated mean resilience, upper boundary, and lower boundary results are provided for each tile in COG format.

Access MODIS-derived vegetation resilience dataset and more information

ABoVE: AVIRIS-NG Imaging Spectroscopy for Alaska, Canada, and Iceland Dataset

The AVIRIS-NG Imaging Spectroscopy for Alaska, Canada, and Iceland, 2017-2022, Version 3 dataset from the ABoVE campaign is now available. This dataset supersedes the previously published ABoVE AVIRIS-NG Level 2 surface reflectance files for the 2017-2019 surveys of Alaska and northwestern Canada. It also includes previously unpublished Level 1 radiance and Level 2 reflectance data for the 2021 surveys in Iceland, when COVID-era policies prevented normal ABoVE flights, and the 2022 surveys, which returned to the ABoVE domain. The dataset comprises ~1,700 individual flight lines covering ~120,000 square kilometers with a nominal spatial resolution of 5 meters. Sampling includes individual transects to capture key gradients like the tundra-taiga ecotone and raster maps of key study areas like the Canadian High Arctic Research Station (CHARS) Greiner watershed, the Mackenzie Delta, and the Utqiagvik/Point Barrow area. This dataset represents one part of a multi-sensor airborne sampling campaign conducted by 11 aircraft teams for ABoVE. The imagery data are provided in ENVI format along with an RGB composite image for each flight line and shapefiles showing imagery boundaries.

Access ABoVE Alaska, Canada, Iceland data and more information

SHIFT: AVIRIS-NG Level 2A Unrectified Surface Reflectance Version 1 Dataset Released

The AVIRIS-NG Level 2A Unrectified Surface Reflectance Version 1 Dataset from the Surface Biology and Geology High-Frequency Time Series (SHIFT) campaign is now available. This dataset contains Level 2A unrectified surface reflectance images from the AVIRIS-NG instrument collected as part of the SHIFT campaign, which occurred February to May 2022, with a follow-up activity for one week in September. 

The SHIFT campaign leveraged NASA's AVIRIS-NG instrument to collect Visible to Shortwave Infrared (VSWIR) data at approximately a weekly cadence across a broad study area, enabling traceability analyses related to the science value of VSWIR revisits. Ultimately, this campaign will generate precise, high-frequency data on plant communities collected over nearly 1,656 square kilometers across Santa Barbara County, California, and nearby coastal Pacific waters. The AVIRIS-NG Level 2A data are provided in ENVI binary format, which includes a flat binary file accompanied by a header (.hdr) file holding metadata in text format.

Access SHIFT dataset and more information

BOREAS AVIRIS At-Sensor Radiance Imagery Dataset Available

The BOREAS RSS-18 Level 1B AVIRIS At-Sensor Radiance Imagery Dataset offers Level 1B AVIRIS radiance data near Prince Albert, Saskatchewan, Canada, on August 14, 1996. The imagery was acquired for the Boreal Ecosystem-Atmosphere Study (BOREAS) project, which enlisted NASA's ER-2 high altitude aircraft in an effort to better understand exchanges of radiative energy, sensible heat, water, carbon dioxide, and trace gases between Canada's boreal forest and the lower atmosphere. These spectra are acquired as images with 20-meter spatial resolution, 11-kilometer (km) swath width, and flight lines up to 800 km in length. The dataset includes the radiance imagery cube for each scene along with calibration and navigation information. The radiance data are in instrument coordinates, georeferenced by center of each scan line, and provided in a binary file. Metadata are included in a mixture of binary and text file formats.

Access BOREAS dataset and more information

Physical Oceanography DAAC (PO.DAAC)

New COWVR-TEMPEST Products Released

NASA’s PO.DAAC released the Compact Ocean Wind Vector Radiometer (COWVR)-Temporal Experiment for Storms and Tropical Systems (TEMPEST) Temperature Sensor Data Records (TSDRs) and Environmental Data Record (EDR) produced by NASA's Jet Propulsion Laboratory. COWVR and TEMPEST are passive microwave radiometers installed on the International Space Station as part of the Space Test Program-Houston 8 (STP-H8) technology demonstration mission. The project aims to demonstrate a lower-cost, lighter-weight sensor architecture for providing microwave data, with the primary objective of ocean surface vector wind products and tropical cyclone intensity tracking for the Department of Defense. 

The datasets include Level 1 TSDRs from both instruments and Level 2 wind vector, column liquid water, and column precipitable water vapor from COWVR (EDR). Data records span January 2022 to the present, with forward streaming planned at least until August 2025. Both Level 1 and Level 2 data provide data over the platform tracks/swaths in HDF5 format. Version 10.0 is the first unrestricted public release of these data, and its name is consistent with the internal version numbering of the project team prior to release.

Access COWVR-TEMPEST products and more information
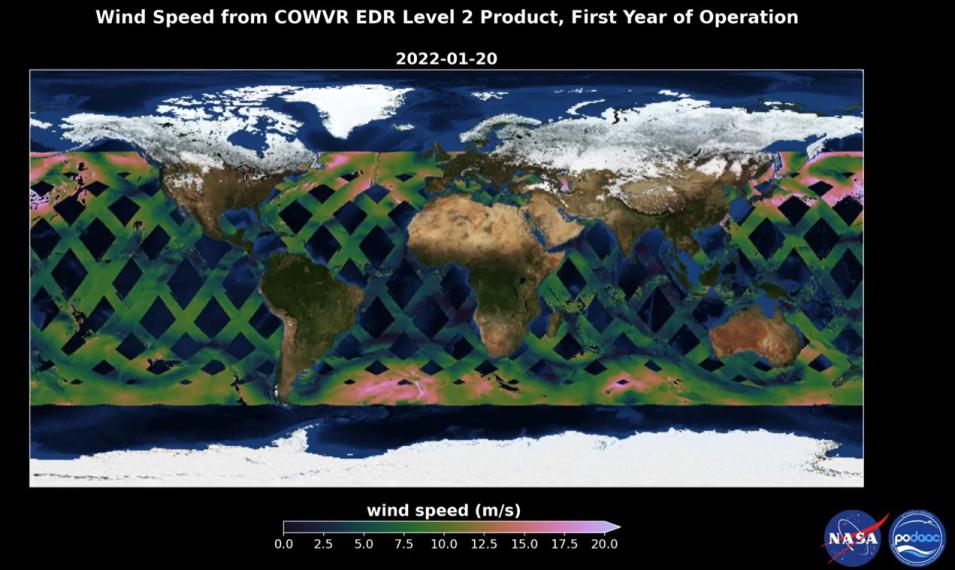
This graphic shows global daily wind speed measurements, in meters per second, from the Compact Ocean Wind Vector Radiometer (COWVR) instrument during its first year of operation. Darker colors (e.g., purple, blue, and green) denote slower wind speeds while brighter colors (e.g., pink and white) show the location of faster windspeeds.
Image Caption

This graphic shows daily wind speed measurements in meters per second from the Compact Ocean Wind Vector Radiometer (COWVR) instrument during its first year of operation. Darker colors (purple, blue, and green) denote slower windspeeds; brighter colors (pink and white) indicate faster windspeeds. COWVR was developed at NASA's Jet Propulsion Laboratory and is installed on the International Space Station, where it has been collecting measurements since January 2022. COWVR aims to demonstrate new low-cost microwave sensor technologies for weather applications. Credit: NASA's PO.DAAC.

New OPERA Dynamic Surface Water Extent Dataset Available

The validated Observational Products for End-Users from Remote Sensing Analysis (OPERA) Dynamic Surface Water Extent from Sentinel-1 (DSWx-S1) Level 3, Version 1 dataset is now available from PO.DAAC. OPERA's DSWx-S1 dataset provides near-global geographical mapping of surface water extent over land at a spatial resolution of 30 meters with a temporal revisit frequency of 6 to 12 days.

Using Sentinel-1A synthetic aperture radar (SAR) observations, DSWx-S1 maps open inland water bodies greater than 3 hectares and 200 meters in width, irrespective of cloud conditions and daylight illumination that often pose challenges to optical sensors. Forward production of the DSWx-S1 data record began in September 2024.

More information about the OPERA DSWx-S1 dataset

Details

Last Updated

Published

Data Center/Project

Atmospheric Science Data Center (ASDC)
Goddard Earth Sciences Data and Information Services Center (GES DISC)
Global Hydrometeorology Resource Center DAAC (GHRC DAAC)
Level 1 and Atmosphere Archive and Distribution System DAAC (LAADS DAAC)
Land Processes DAAC (LP DAAC)
National Snow and Ice Data Center DAAC (NSIDC DAAC)
Oak Ridge National Laboratory DAAC (ORNL DAAC)
Physical Oceanography DAAC (PO.DAAC)