Dr. Philip Brodrick

NASA has long used imaging spectroscopy to peer into space. Now, scientists are using the technology to take a closer look at Earth.

From its perch on the exterior of the International Space Station 250 miles above the planet, NASA's Earth Surface Mineral Dust Source Investigation (EMIT) imaging spectrometer has one job: mapping the surface composition of Earth's mineral dust source regions. It's an important task. Not only will this information help scientists know what minerals reside in Earth's dust source regions, but the creation of such a map will improve the computer models that scientists use to assess the regional and global heating and cooling effects of mineral dust both now and in the future.

At the core of the EMIT mission is the science of imaging spectroscopy, an advanced technology invented by NASA for use in space missions designed to study celestial objects and other phenomena. In EMIT's case, the spectrometer is directed toward Earth rather than away from it. For each location the instrument sees, it measures the spectrum of light—from the visible into the infrared—reflected from Earth's surface. These measurements are what reveal the distinct spectral signatures (or 'fingerprints') of the minerals in the planet's dust source regions and make the creation of that mineral map possible.

Of course, spectroscopy can be used to detect more than minerals. In the following Data Chat, Dr. Philip Brodrick, data scientist, software systems engineer, and research technologist at NASA's Jet Propulsion Laboratory (JPL) in Pasadena, California, discusses the technology's benefits, the ways scientists are beginning to use it to study a wider variety of environmental interactions (such as the physiology of terrestrial vegetation and aquatic systems, snow and ice accumulation, and surface change), and how collaborative efforts to develop, improve, and apply the algorithms for spectroscopy data have spurred the field’s rapid growth.

What is satellite spectroscopy?

Spectroscopy, or imaging spectroscopy, as we tend to call it for this particular class of instruments, is a tool that's been around for a long time. Historically, it's been used to look away from Earth, not toward it. That's because if you're looking at a star, or an exoplanet, or something that's really far away, you can use the specific absorptions of light to tell you something about the composition of that object. This same technology is equally valuable for looking at the Earth system. It can tell you something about the structure and the composition of what you're looking at; and the higher the spectral resolution with which you look at it, the more information you get out of it.

A great challenge with spectroscopy is that instead of a three-band RGB image, you have an image with hundreds of wavelengths, so it's way more data dense. But, of course, that's where its value lies. It's really been over the last five or so years that the use of spectroscopy has picked up. There's been a dedicated spectroscopy community within the Earth science domain for decades, but the scale of what you can do now is transformative. Now we have one of the very best of these instruments ever built—the EMIT imaging spectrometer—in orbit.

Why is the EMIT spectrometer so well suited to measuring Earth's mineral dust?

EMIT models Earth's surface mineralogy, not the dust in Earth's atmosphere. That's because the material in the atmosphere is highly intermittent. Why is EMIT's spectrometer so well suited for that? Mineralogy is more or less the poster child for what you can do with a spectrometer because it's got these big bold absorption features in different parts of the spectrum. These absorption features allow us to identify the distinct signatures of the minerals in dust source regions. So, if you were looking at it from another multiband imager, you might see a feature on the landscape that's associated with a class of minerals, but you wouldn't be able to tell which one. With EMIT, those absorption features tell you what it is and how much of that material is there. The real big thing that EMIT makes possible is the ability to determine those abundances, not just the presence or the absence. There is a plethora of other applications for spectroscopy, but minerology is really a prime example.
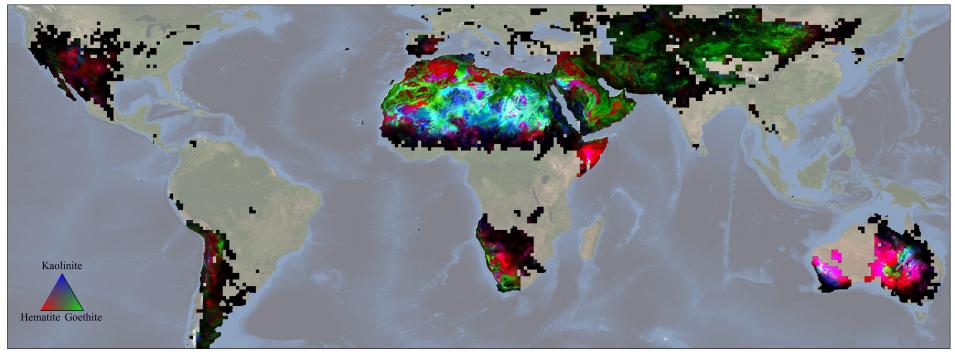
global map with colors indicating minerals across Earth
Image Caption

NASA's EMIT team used data from the year ending in November 2023 to produce the first global maps of hematite, goethite, and kaolinite found in Earth’s dry regions. The mission collected billions of measurements of the three minerals along with seven others that may affect climate when lofted into the air as dust storms. Credit: NASA/JPL-Caltech.

Speaking of other applications, in addition to the EMIT mission, you're also involved in NASA's Surface Biology and Geology mission. What are its aims and what will satellite spectroscopy bring to this mission?

The Surface Biology and Geology (SBG) mission has two big components: a thermal infrared component and a Visible to Short Wavelength Infrared (VSWIR) spectroscopy component. It's going to be focused on looking at change in surface composition through time. So, instead of seeing stuff whenever the [International Space Station] passes overhead and being capped at a 7.4 megabit per second downlink rate (as we are with EMIT), we're going downlink about 18 terabits per day. Around every two weeks we'll get a pass over every location on the planet within plus or minus 80 degrees.

These repeat observations will let us extend the use of imaging spectroscopy into different domains. So now, in addition to looking at mineralogy, which is pretty static and allows us to take our time to collect a big mosaic of the planet and get a base map of its mineralogy, SBG's VSWIR instrument will allow us to use the same approach to look at things like vegetation, snow, and ice, whose physical properties are changing all the time.

You're also involved with airborne spectroscopy missions, including the Airborne Visible/Infrared Imaging Spectrometer (AVIRIS), the Airborne Visible/Infrared Imaging Spectrometer-Next Generation (AVIRIS-NG), and the National Ecological Observatory Network (NEON). How is spectroscopy playing a role in these missions and how does having a spectrometer on an airplane differ from having one in space?

Before NASA puts a spectrometer in space, we typically operate an analogue from the air because it's a lot cheaper, it’s easier to tinker with, and you can learn a lot more about how it functions. You can also coordinate with field campaigns far easier from an airplane than you can from space. You can communicate directly between the airplane and folks on the ground, which helps get calibration and tuning data for different algorithms. Also, airborne spectrometers have a much higher spatial resolution. It's really hard, or at least very expensive, to collect these data at a fine spatial resolution from space. Airborne missions let you get the data you need at the spatial and temporal resolutions you’re after for a specific project, and those parameters can change from one project to another. This lets science teams use airborne data to better understand what's possible and what's not before a particular configuration gets locked down for a mission in orbit. All of these data then get used to calibrate and train the models that our teams use with these spectrometers in orbit.

Fundamentally, the algorithms that we're currently using in orbit were developed from airborne platforms. Then we've modified and adapted and changed them once EMIT started operating and we started to figure out what works what doesn't at the global scale. But we have to learn that from the aircraft side to start with. The sensors that we've been talking about—AVIRIS classic, AVIRIS-NG, all of the NEON imaging spectrometers, and the Global Airborne Observatory (GAO)—are all the same class of spectrometer and are all being used to develop this field by many different scientists.

The EMIT spectrometer is kind of the next generation of these instruments. It uses a different optical setup (a Dyson design) and it's performing extremely well. The team also just started flying AVIRIS-III, which is basically an airborne clone of the EMIT spectrometer, and the team is using that platform for calibration and validation activities. AVIRIS-III is also proving to be an excellent instrument for high-resolution greenhouse gas work.

Are there any other major applications?

Many! One of the airborne campaigns that I was just involved in, the Biodiversity Survey of the Cape (BioSCape) campaign, was conducted to investigate the biodiversity of the Cape Floristic Region in South Africa. NASA brought four sensors: AVIRIS-NG; the Portable Remote Imaging Spectrometer (PRISM), which is a spectrometer that's optimized for aquatic systems; the Hyperspectral Thermal Emission Spectrometer (HyTES); and the Land Vegetation and Ice Sensor (LVIS), which is a waveform lidar. The sensors were flown on two NASA aircraft in this incredibly complicated, incredibly biodiverse region with different field teams [collecting] data on the ground. It was a test case to say, "Can we actually measure biodiversity in this really complex system? Can we figure something out about it?" If we can't do it with a group of airborne sensors operating together with people on the ground, we can't do it from orbit. We put all of these data together and then we try to figure out what can be retrieved operationally. A lot of things don't work, of course, but this is how we figure it out: What is the detection limit? What is the next signal we can get to?

Imaging spectroscopy used for greenhouse gas detection is also having a bit of a moment. EMIT has performed really well in that space, the Carbon Mapper is slated to come online soon, and AVIRIS-NG and AVIRIS III are providing these data on the airborne side. In some ways, viewing greenhouse gas detections from space is tragic, because the data can only tell you about the biggest emitters—and there are a lot of them. When I started looking at these data across the planet, the frequency and scale were truly shocking. But until we have the sensors that can detect these emissions, we can't see it. It’s been a rewarding project to work on because anything you can do to make the retrievals for greenhouse gas detection better, to get data into users hands more expediently, or anything that you can do to get more people to use these data to go out and find sources and fix leaks, that's just an exciting thing to be a part of.

AVIRIS, one of NASA’s airborne missions has been used to evaluate EMIT’s spectroscopic approach to mapping mineral composition.
Image Caption

One of NASA's airborne missions has been used to evaluate EMIT's spectroscopic approach to mapping mineral composition. In the Salton Sea region of California, the Airborne Visible/Infrared Imaging Spectrometer (AVIRIS) instrument collected the large dataset in the figure above. By obtaining a spectrum for every point in the Salton Sea image (left), AVIRIS successfully mapped the minerals hematite, goethite, calcite, and kaolinite based on their distinct spectral signatures (colored areas in Salton Sea image on right). These are key minerals for the EMIT investigation. Credit: NASA/EMIT.

What should data users, especially those who may be new to working with spectroscopy data, need to know to use these data effectively? Are there are any particular challenges or hurdles?

The first thing that a user should know is that there's an excellent suite of tutorials on the website of NASA's Land Processes Distributed Active Archive Center (LP DAAC) that will help familiarize them with how to use these data. There’s a large number of emerging tools and resources out there that can help folks get involved in the field, both domestically and internationally. For example, our colleagues in Europe have put together some resources—the Environmental Mapping and Analysis Program (EnMAP) mission in particular has done a phenomenal job of building resources and tutorials and pulling all of this information together.

The other thing that I think that users should be aware of is that a spectrometer in orbit is different from a spectrometer on an aircraft. People that have worked on aircraft campaigns for a long time will tell you, "Every spectrometer and every campaign is special." There are always challenges that come up over the course of a campaign. The calibrations tend to be different, the instrument is repeatedly installed and uninstalled, the environment is warming up and cooling—it has to endure all of these variations that we don't see with something in orbit.

Of course, the compromise is that space is a harsh environment. Everything about putting hardware in space is challenging and anything can go wrong at any minute. But we're lucky with EMIT in that we had a phenomenal instrument team, and its performance in space has been a lot more stable than what I at least have been used to working with in airborne campaigns. So, taking EMIT data off the shelf and using [the data] feels relatively easy. Every time I go back and work with airborne data I say, "Oh, we have to work on every detail here again for every campaign," whereas it just kind of flows off the shelf with EMIT. That's not to say that there aren't challenges, but it's a lot more stable and consistent product than we've ever gotten from an airborne campaign. For folks that are coming into the field for the first time, it'll be a total boon because not only will they be much more likely to find data over the location that they’re interested in, but they can expect each scene to be pretty consistent with other scenes.

Based on what we've discussed, it seems safe to say that the field of spectroscopy is expanding rapidly in regard to both the amount of spectroscopy data that are available and their application.

It is growing rapidly. We know how to do a lot of things. There are a lot of fairly mature algorithms out there and we're getting the opportunity to apply them in new domains. But the growth in the retrieval domain is huge. Over the past couple years, the number of people involved in the field is much higher than it was before and the number of methods that are out there and the success of those methods are growing. Part of the reason for that is the huge effort underway to make everything more open and accessible.

I would strongly encourage anyone to check out the [EMIT] open-source repository. All the code that we use operationally for EMIT is in the public domain on GitHub. People can take it and branch it and do their own work from that fork or make improvements and submit pull requests back, too. This is a community where we have a bunch of algorithms that are out there that are constantly getting better. Colleagues at other NASA centers, at universities, and in industry are collaborating with us on the same repositories for critical pieces of that process. That's huge. That's how they get better and it's a fresh enough field that I think new users should feel very empowered to participate in that process. There's so much to do and so many cool things to do in this field right now. You don't have to be a seasoned spectroscopy veteran to get involved.

Details

Last Updated

Data Center/Project

Land Processes DAAC (LP DAAC)
Oak Ridge National Laboratory DAAC (ORNL DAAC)