Dr. Yehuda Bock

Bock provides NASA's Crustal Dynamics Data Information System (CDDIS) with data products based on ground displacement data.

Dr. Yehuda Bock, Distinguished Researcher and Senior Lecturer at the Scripps Institution of Oceanography's Institute of Geophysics and Planetary Physics

Research Interests: Crustal deformation, tectonics, and earthquake studies using space geodesy; mitigation of natural hazards using geodetic methods; meteorological and climatological applications of the Global Navigation Satellite System (GNSS); geodetic data science and machine learning.

Research Highlights: If there were a list of the technologies most often taken for granted, the Global Navigation Satellite System (GNSS) would be somewhere near the top. Although millions of people around the world rely on it every day to navigate from one address to another, share information over wireless networks, or fly on airplanes, it seems few are aware of the vast global network of ground receivers and the international constellation of satellites that make GNSS possible.

Among those who are familiar with GNSS and the myriad ways this technology benefits human civilization is Dr. Yehuda Bock, distinguished researcher and senior lecturer at the Scripps Institution of Oceanography’s (SIO) Institute of Geophysics and Planetary Physics in La Jolla, California. Along with his colleagues from SIO and NASA's Jet Propulsion Laboratory (JPL) in Southern California, Bock produces a suite of GNSS-derived data products as part of the Enhanced Solid Earth Science Earth Science Data Record System (ESESES), a project of NASA's Making Earth Science Data Records for Use in Research Environments (MEaSUREs) Program. ESESES is a collaborative activity between JPL and the Scripps Orbit and Permanent Array Center (SOPAC), a research group that uses geodetic and seismic data for a wide range of geodetic, geophysical, surveying, and engineering initiatives.

"We provide, on an operational basis, several levels of Earth science data records (ESDRs) using GNSS," Bock said of his work with the ESESES project. "These products, some of which extend more than three decades, are regularly published at NASA's Crustal Dynamics Data Information System (CDDIS), the agency's archive of space geodesy data."

Established in 1992 and located at NASA's Goddard Space Flight Center in Greenbelt, Maryland, CDDIS is one of the 12 Distributed Active Archive Centers (DAACs) in NASA's Earth Observing System Data and Information System (EOSDIS). CDDIS supports the international geodesy and greater scientific communities by archiving and freely distributing data derived from four geodetic techniques: satellite laser ranging (SLR), very long baseline interferometry (VLBI), Doppler Orbitography and Radiopositioning Integrated by Satellite (DORIS), and GNSS. In addition, CDDIS is a core component of the services established under the International Association of Geodesy (IAG), an organization that promotes scientific cooperation and research in geodesy on a global scale.

Geodesy is the science of determining the exact position of an instrument on Earth's surface to the centimeter or sub-centimeter level, and global cooperation is integral to its veracity and advancement. This cooperation is inherent in GNSS, which is made up of satellite navigation systems from several countries, including the U.S. Global Positioning System (GPS) and the European (GALILEO), Russian (GLONASS), and Chinese (BeiDou) systems. In addition, the international geodetic community has established GNSS monitoring stations at thousands of locations around the world. Each one of these stations contains an antenna and a receiver that picks up radio signals from the multitude of GNSS satellites. Using specialized geodetic software, scientists can then monitor the positions of these receiving stations—with a precision of about one millimeter—and track their movement (displacement) over time.

Bock and his ESESES colleagues use these data to create a variety of data products at different processing levels that scientists and resource managers in fields ranging from agriculture to seismology can use to better understand the processes that shape Earth's surface and their impact on both the natural and built environment.
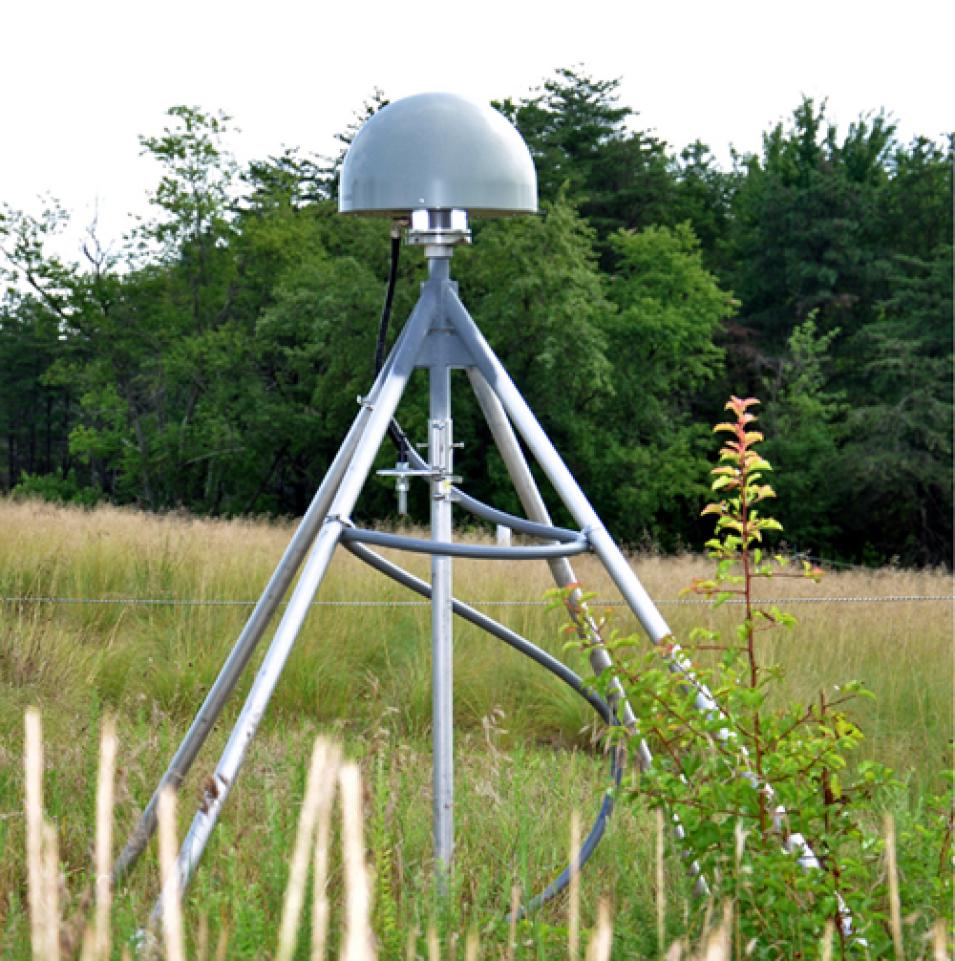
This image shows a four-legged GNSS antenna under a protective dome atop a deeply-anchored geodetic monument to reduce spurious local ground motions.
Image Caption

GNSS receivers detect, decode, and process signals from GNSS satellites, which transmit ranging codes on two radio-frequency carriers. This allows the locations of GNSS receivers to be determined with varying degrees of accuracy. Shown is a GNSS antenna under a protective dome atop a deeply-anchored geodetic monument to reduce spurious local ground motions. Credit: NASA's CDDIS.

"We produce four levels of ESDRs starting with raw GNSS data, with each level building on the previous one," Bock explained in a recent NASA Earthdata webinar. "The raw GNSS data at Level 0 collected in 24-hour segments from thousands of stations are independently estimated by JPL and SOPAC. These analyses result in the Level 1 raw daily displacements time series. Then, these raw daily displacements from JPL and SOPAC are combined into a single Level 2 dataset of daily station displacements after a process of rigorous calibration and validation, which is critical at these levels for the integrity of the higher-level products."

Included among the higher-level (i.e., Level 3 and Level 4) products are datasets pertaining to crustal motions due to earthquakes (coseismic and postseismic motions) and tectonic transients, which are critical for mitigating the effects of a range of natural and anthropogenic hazards.

Although it's tempting to think of Earth's surface as a single solid mass, it's composed of tectonic plates that are in motion relative to each other. The boundaries of these plates are diffuse and can occur over a boundary several hundred kilometers wide. Therefore, it is important for the geophysicists who assess ground hazards to be able to estimate changes in ground motions over and above the mostly steady tectonic motions occurring over a large area. GNSS data are key to these assessments.

"[GNSS data] are used for improving earthquake probability assessments, which forecast the probability of an earthquake of a certain magnitude in X number of years in a particular area," Bock said. "Using [GNSS data], in addition to other types of information, scientists can model the microphysical processes within Earth's crust, which then helps them better understand the earthquake process. So, [GNSS data and data products] underlie the physical models and improve their probability assessments."

While discovering physical transience is important for enhancing knowledge of earthquakes and associated hazards, it also has serious implications for groundwater management, agriculture, and water transportation systems, as periods of drought and increased groundwater use can result in subsidence—vertical motions of the crust.

"In areas like the Central Valley of California, you can have subsidence of the crust of about 0.2 meters [7 to 8 inches] per year. If there's a drought, the farmers and others who depend on water will extract more groundwater from the aquifers and the rate of subsidence provides an estimate of how much groundwater has been used," Bock said. "Then, when there's rainfall, you can see how the subsidence lessens over time, which provides an idea of the groundwater content. This is useful information for hydrologists, who can use this GNSS subsidence data to constrain their models of water storage and water flow."

Because vertical subsidence can feed into horizontal movements, GNSS subsidence data are also useful to those responsible for monitoring water infrastructure. This is vital in a state like California, where residents rely on aqueducts to move water from the northern to the southern part of the state.

"Ground subsidence can damage these pipelines, so it's important for the Department of Water Resources, which is responsible for tracking the movement of water throughout the state, to have this information," Bock said. "This, of course, is a big part of our infrastructure and our lives here in the state."

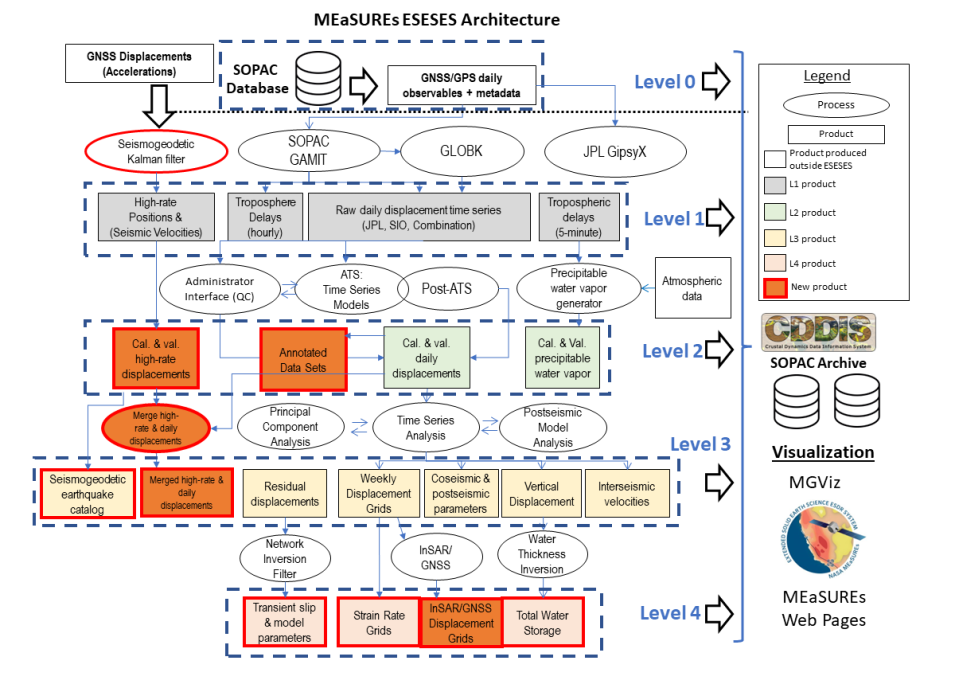
This graphic shows the hierarchy of the ESDRs that Bock and his colleagues produce, with each level building on the previous one. The raw GNSS data at Level 0 collected in 24-hour segments are independently estimated by JPL and SOPAC. These analyses result in the Level 1 raw daily displacements time series, which are then combined into a single Level 2 daily set of daily station displacements after a process of rigorous calibration and validation.
Image Caption

Bock and his ESESES colleagues produce four levels of ESDRs starting with raw GNSS data, with each level building on the previous one. The raw GNSS data at Level 0 collected in 24-hour segments from thousands of stations are independently estimated by JPL and SOPAC. These analyses result in the Level 1 raw daily displacements time series. These JPL and SOPAC raw daily displacements are then combined into a single Level 2 set of daily station displacements after a process of rigorous calibration and validation, which is critical at these levels for the integrity of the higher-level products. Recently, SOPAC and JPL have been awarded another five-year MEaSUREs project to continue to produce data products (new ESDRs are denoted in red). Credit: ESESES project.

Extreme weather events, like the series of atmospheric rivers that brought record amounts of rain and flooding to California's central, southern coast, and Sierra Nevada regions in the early months of 2023, are often part of California residents' lives, too. Surprisingly, data from GNSS stations can help mitigate the impact of severe weather, just as they do with movements of Earth's crust.

Along with information about their positions on Earth's surface, GNSS receivers also provide scientists with information about the atmosphere itself, including the time it takes a signal to travel from GNSS satellites to a particular receiver. This travel time is affected not only by the distance between the receiver and the satellites, but also by the amount of moisture in the atmosphere. Because of this, when researchers estimate a station's position, as they do when generating geodetic products, they also automatically estimate what's known as tropospheric delay, or the delay in signal transmission due to concentrations of atmospheric water vapor.

This image of the Pacific Northwest shows isochrones--contours representing the movement and extent of water vapor--of one of the atmospheric rivers that impacted southern California in the winter of 2023. The image is derived from the daily 5-minute GNSS Precise Point Positioning (PPP) Tropospheric Estimates produced by JPL as part of the ESESES project. The blue dots represent locations wherein water vapor concentrations are high. The yellow, orange, and red indicate where concentrations are low.
Image Caption

This image shows isochrones (contours representing the movement and extent of water vapor) of one of the atmospheric rivers that impacted southern California in the winter of 2023. The image is derived from the daily 5-minute GNSS Precise Point Positioning (PPP) Tropospheric Estimates produced by JPL as part of the ESESES project. Additional ESESES products for Disaster Monitoring, Crustal Deformation, Extreme Weather, and Other Applications are available on the CDDIS ESESES Products page. Credit: Katherine Guns, SIO.

The distribution and variation in the amount of atmospheric water vapor is a key component in both cloud formation and the chemistry of the lower atmosphere. Because increases in water vapor are associated with extreme weather events, meteorologists are keen to monitor atmospheric water concentrations and the location of these concentrations.

"We've been working with the National Weather Service (NWS) offices in San Diego and [Los Angeles] Counties who use [these] data to monitor the velocity of the water vapor transport and the total area it reaches," Bock said. "What they're interested in seeing is the spatial extent of the rainfall and how it’s moving across the region, so this is useful information."

GNSS water vapor data are also used as inputs for refining and improving weather models used to forecast extreme events.

Creating data products that meet the requirements of a specific application, such as improving forecast models or addressing fundamental science questions, is precisely what NASA's MEaSUREs Program is designed to do. And as the list of data products that Bock and his ESESES project colleagues have developed for those in and beyond the geodetic community indicates, they are leaders in providing long-term calibrated and validated GNSS-derived ESDRs that meet a range of real-world applications and needs.

"We are living in a period of increasingly extreme, frequent natural and anthropogenic hazards and it’s becoming more difficult to make critical, informed decisions regarding the safety of human life and critical infrastructure," Bock said in the Earthdata webinar. "Geodetic data, methodologies, and operational capabilities developed under NASA MEaSUREs projects is our contribution to achieving a better understanding and mitigation of the effects of these hazards."

Thanks to CDDIS, those contributions will be archived and distributed to the ever-increasing user community of geodetic data users for years to come.

Representative Data Products Used or Created:

All products are available through NASA's CDDIS:

Read about the Research:

Bock, Y., Moore, A.W., Argus, D.F., Fang, P., Jiang, S., Kedar, S., Knox, S.A. Liu, Z., & Sullivan A. (2021). Extended Solid Earth Science ESDR System (ES3): Algorithm Theoretical Basis Document: Section 4.2.

Explore more Data User Profiles

Details

Last Updated

Data Center/Project

Crustal Dynamics Data Information System (CDDIS)