Key Takeaways
- H2Plastic, one of the winning teams from the 2024 Pale Blue Dot: Visualization Challenge, found that microplastic concentrations along the Brazilian coast are elevated beyond acceptable standards
- Microplastics are not only an ocean pollutant, but contaminate coastal fish populations, an important food source
- Spreading awareness of this issue is vital to protecting the health of coastal communities—both human and marine
- NASA Dataset: CYGNSS L3 Ocean Microplastic Concentration V1.0
Overview of H2Plastic
H2Plastic addresses an issue that remains inadequately explored, particularly within Brazilian communities. We have observed significant pollution, with individuals habitually discarding waste—notably plastic—onto the streets. Much of the waste ultimately finds its way into the ocean and undergoes degradation due to environmental factors, transforming into microplastic particles. These microplastics are so tiny (smaller than five millimeters) that they are often ingested inadvertently by marine animals. When people in local communities then eat the contaminated fish, these microplastics may pose health risks.
Through our research, we have concluded that access to satellite data regarding microplastic concentrations in the sea is crucial for comprehensively studying the impacts and patterns of this issue as well as for seeking effective solutions. We used ocean microplastic concentration data from NASA’s Cyclone Global Navigation Satellite System (CYGNSS) mission to illustrate the impact of microplastics on marine biodiversity and human health.
Visualizing CYGNSS Data
Our team had more than 2GB of data in netCDF files from April 2017 to September of 2018. To start processing these data, we used Xarray, a Python library that is used to work with DataFrames in the netCDF format.
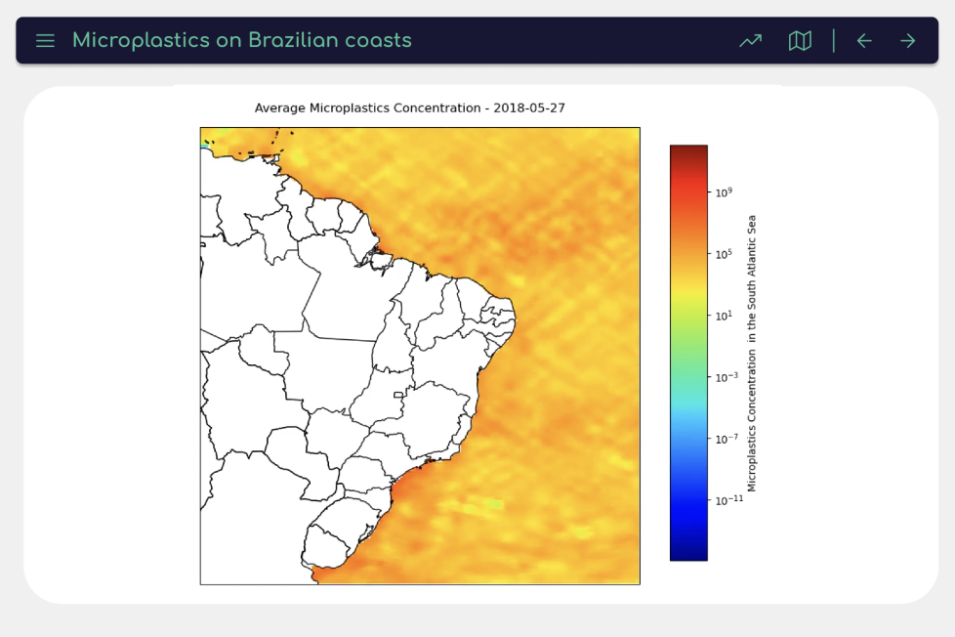
Using Xarray and NumPy, we processed the data to filter microplastic concentration data of just the Brazilian coasts. We then used Matplotlib to plot graphics that could show us the increases and decreases of microplastic concentrations in some areas of the Brazilian coast, including the coasts of São Paulo, Rio De Janeiro, Bahia, Rio Grande do Norte, and other Brazilian states.
We also used a dynamic visualization technique employing Cartopy together with the Matplotlib animation library to generate a video showcasing the movement of large areas of microplastic concentrations over the months covered by our dataset. This allowed us to visually observe the fluctuations in microplastic concentrations along the Brazilian coasts.
