Pale Blue Dot: Visualization Challenge Winners Announced

Five international teams took home top honors in a challenge to use open data to create visualizations highlighting the themes of zero hunger, clean water, and climate action.

Openly available Earth observation data took center stage in a unique competition that brought together 1,591 international participants—71% of whom had never worked with Earth observation data—to create data visualizations around the themes of zero hunger, clean water, and climate action.

Top awards in the Pale Blue Dot: Visualization Challenge went to five teams consisting of members from the U.S., Mexico, Brazil, Kenya, Senegal, and Argentina. Along with the top awards, the Community Code Bonus Prize was awarded to a participant from Botswana; 33 global teams received Honorable Mentions for Compelling Visuals.

The objective of the challenge was to use open data to create visualizations advancing the United Nations (UN) Sustainable Development Goals (SDGs) of zero hunger, clean water, and climate action. NASA goals for the competition were to increase engagement with openly available Earth observation data and promote open science. Submitted visualizations were required to use at least one publicly available Earth observation dataset collected by a U.S. government agency, and all data used had to be freely and openly accessible.

"Data challenges like the Pale Blue Dot are a fantastic opportunity to use NASA's open data to help address some of the greatest challenges facing humanity, like those posed by the Sustainable Development Goals," says NASA Senior Program Executive for Scientific Data and Computing Dr. Steve Crawford. "These challenges provide an opportunity for diverse, creative, and innovative teams to develop solutions using NASA open data to address these challenges."
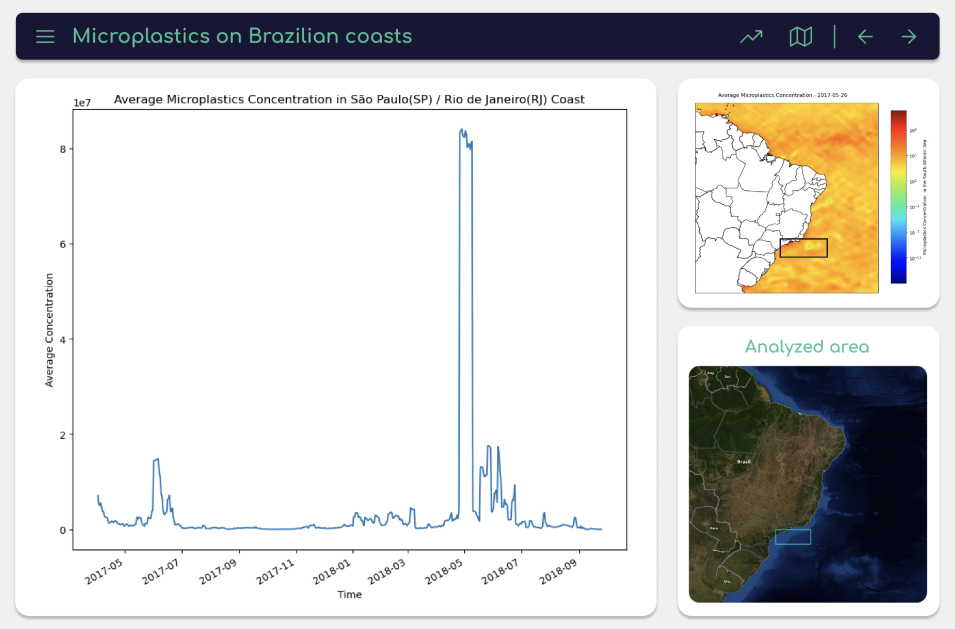
Three panel dashboard. Left panel has a bar graph with a spike right of center; two right images show the country of Brazil with data location maps
Image Caption

Top award winner H2plastic created a dashboard using Cyclone Global Navigation Satellite System (CYGNSS) Ocean Microplastic Concentration data (doi:10.5067/CYGNS-L3M10) from NASA's Physical Oceanography Distributed Active Archive Center (PO.DAAC) to plot average microplastic concentrations along the coast of Brazil. The four members of the all-Brazil team focused on coastal Brazil states that had high seafood consumption and where microplastic accumulation was most evident. Credit: NASA Pale Blue Dot Competition, Copyright 2024 Ruan Vitor Cordeiro da Silva.

Participants were provided a list of almost a dozen Earth observation datasets along with detailed information about how to access, download, and work with the data. Almost all suggested datasets were available through NASA’s Earthdata Search.

Out of the 131 project submissions, the most popular mission and instrument data and imagery sources used were the joint NASA/USGS Landsat series of satellites and NASA’s Moderate Resolution Imaging Spectroradiometer (MODIS) instrument. Water movement data from the joint NASA/German Aerospace Center Gravity Recovery and Climate Experiment (GRACE) mission and trace gas measurements acquired by the Atmospheric Infrared Sounder (AIRS) also featured in many submissions.

The Pale Blue Dot competition was created by DrivenData Labs on behalf of NASA and the U.S. Mission to International Organizations in Vienna (UNVIE), in collaboration with the UN Office for Outer Space Affairs (UNOOSA). The competition was managed by the NASA Tournament Lab, an agency effort that facilitates the use of crowdsourcing to tackle NASA challenges.

Winners were selected by a judging panel of technical and subject matter experts, with winning teams getting to attend a 10-day Space Study program with travel, lodging, and tuition covered.

More Information and External Resources

Details

Last Updated

Published