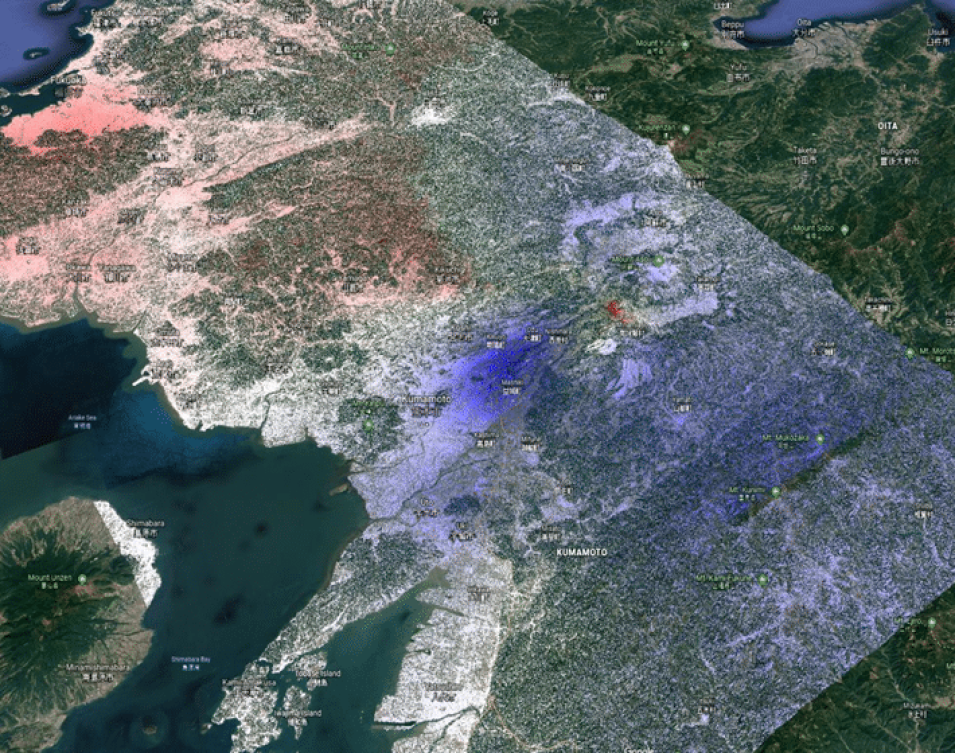
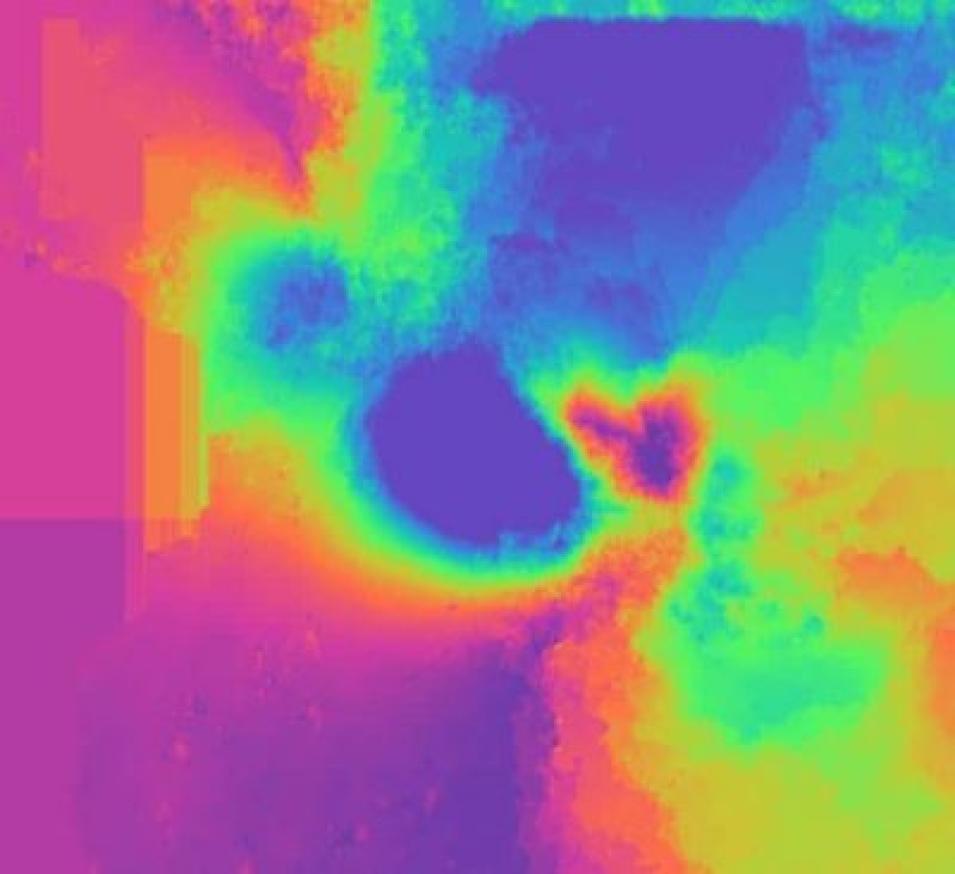
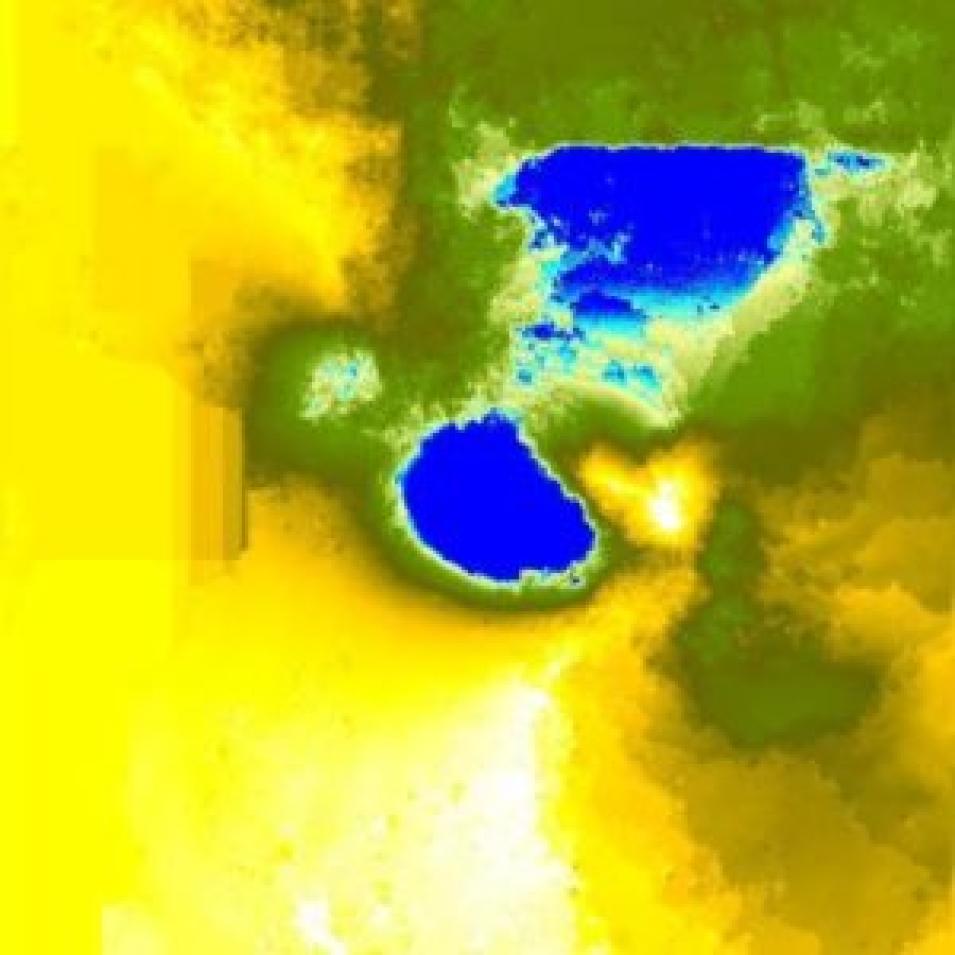
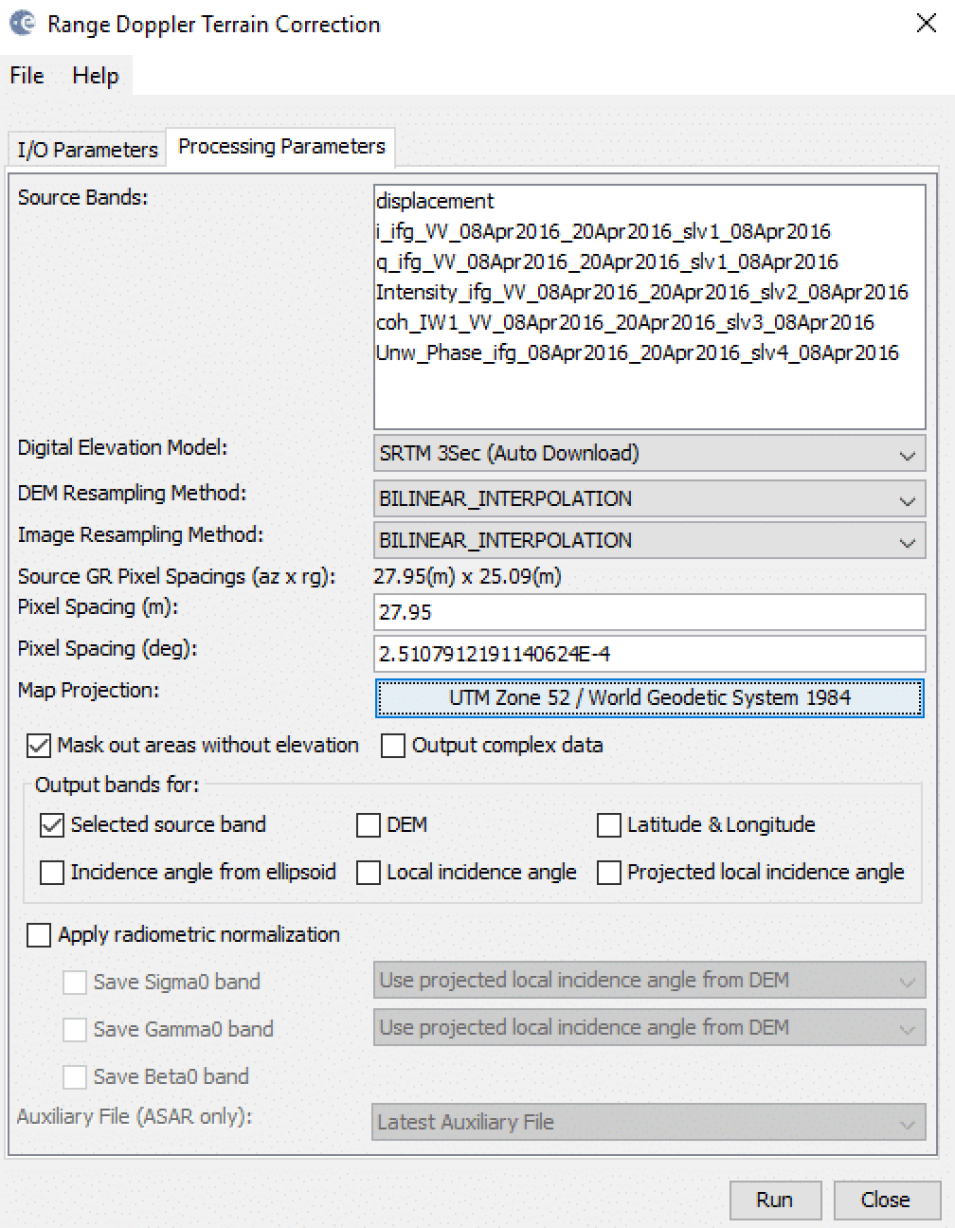
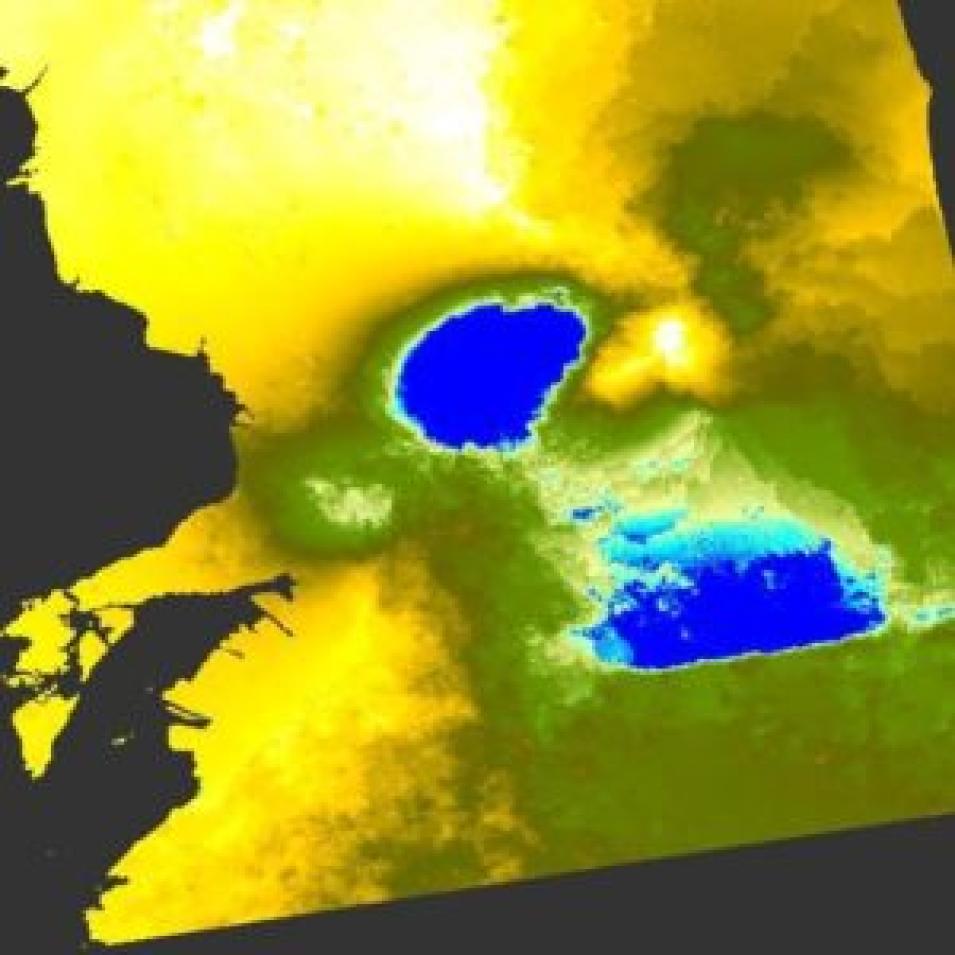
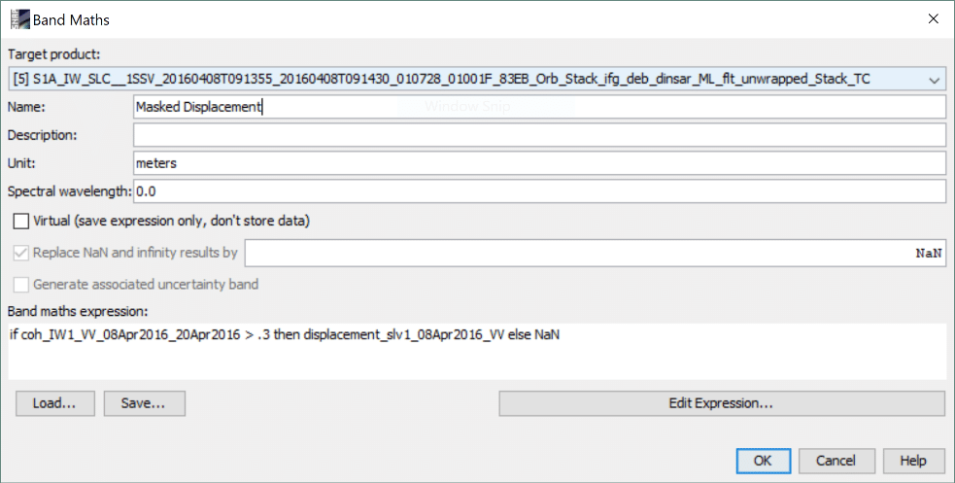
Continuing from the recipe How to Phase Unwrap an Interferogram, this final InSAR recipe will bring our unwrapped phase information out of abstraction into actual displacement units (meters). This recipe will go over the steps of converting the phase values to line-of-sight or vertical displacements as well as discarding data of low correlation that is likely unreliable.
Interpretation
Coherence
Coherence values must also be recognized in order to assess the validity of our displacement map. In general, coherence is the relative uniformity of phase difference between two interfering waves. In the context of SAR interferometry, this assessment is estimated from the random noise and amplitude differences that exist within a resolution cell, or pixel as viewed in the S1TBX. Areas of decorrelation (loss of coherence) should be ignored when interpreting accurate displacement values.
Coherence loss is cumulative from multiple sources:
- Temporal changes such as the growth of vegetation or snow fall
- A low signal-to-noise ratio
- Weak signal return
- Altitude changes in the range or azimuth directions (coherence is most severe when this difference is within a resolution cell)
This recipe will go over the steps necessary to remove incoherent data from the displacement map.
Geometry
The displacement values themselves can also be ambiguous. First, they are a measure of the line of sight component of displacement only. This can be converted to a vertical displacement using trigonometry but this assumes that all of the motion was actually vertical. Earthquakes for example can produce displacements in any direction. Second, it can be difficult to tell if a positive value refers to uplift or subsidence. Because the previous recipes in this series used the earlier SLC as the master image, we are assuming the positive value refers to uplift. In the phase values, the opposite is true since this is a measure of how much the satellite has moved away from the ground, not the other way around. The phase to displacement conversion includes a negative sign which corrects for this.
Background
This recipe covers the final steps in deriving displacement data from a Sentinel-1 SLC pair (and interferogram), and builds on two other ASF Data Recipes. A wrapped interferogram is generated using the ASF Create an Interferogram data recipe, then the ASF Phase Unwrapping recipe walks you through unwrapping the interferogram. This recipe picks up where the Phase Unwrapping recipe left off.
In order to create a deformation map from an unwrapped interferogram, phase values must first be converted to displacement (in meters). This displacement value is derived from the differential phase values in the line of sight of Sentinel-1. Hence, the displacement value will also be relative to the sensor at the look angle, or angle of incidence, and not an absolute vertical displacement.
Coherence values must also be determined in order to assess the validity of our displacement map. In general, coherence measures how well the two images that formed the interferogram are correlated. In the context of SAR remote sensing, this assessment is estimated from the random noise and amplitude differences that exist within a resolution cello, or pixel as viewed in the S1TBX. Areas of decorrelation (loss of coherence) should be ignored when interpreting accurate displacement values.
Coherence loss is cumulative from multiple sources:
- Temporal changes such as the growth/movement/harvest of vegetation or snow accumulation/melting between the two SLC images
- A low signal-to-noise ratio
- Weak signal return
- Altitude changes in the range or azimuth direction (coherence loss is most severe when this difference is within a resolution cell)
Consequently, coherence tends to be highest in urban areas due to low temporal decorrelation and high backscatter intensities. Low coherence is indicative of water bodies and areas with a high vegetation index. Processes such as erosion and deposition can also cause decorrelation depending on the degree of backscatter divergence.
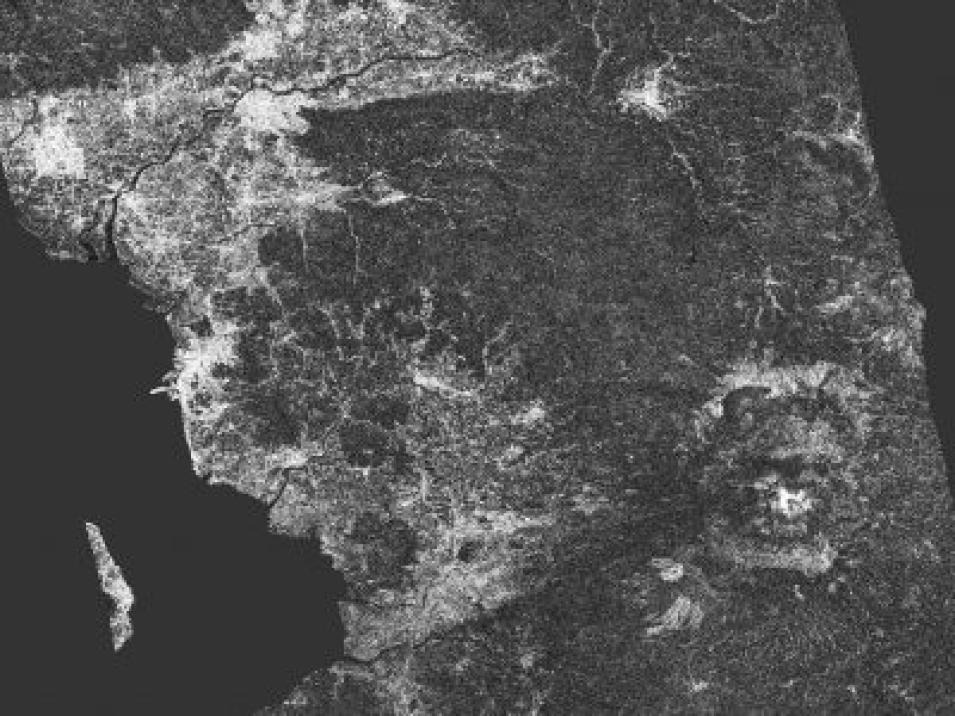
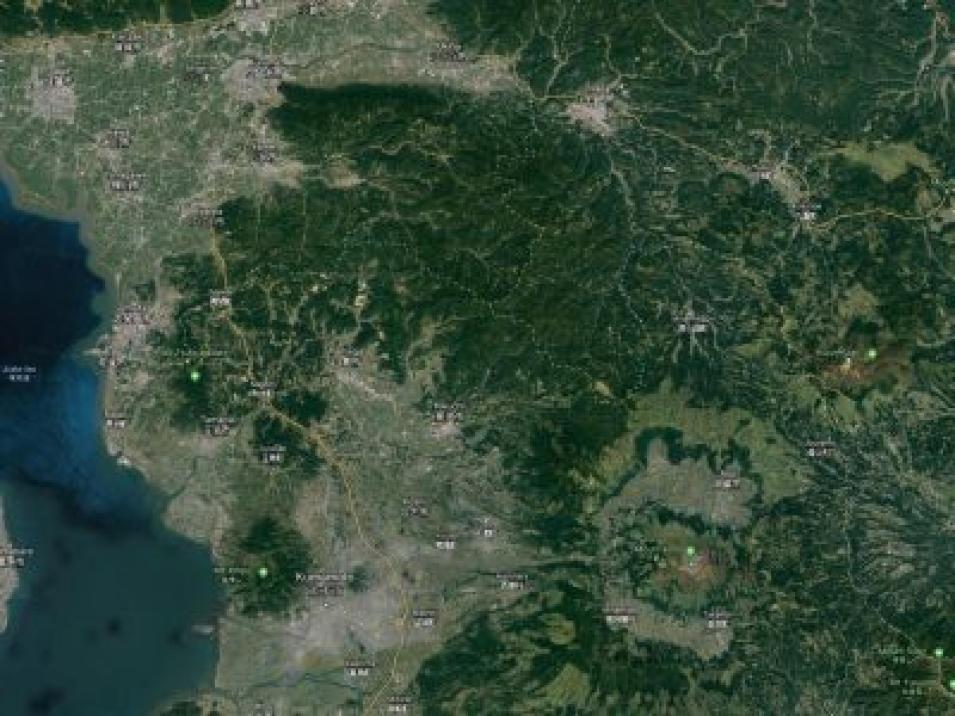
This is exemplified in the area surrounding the cities Kumamoto and Fukuoka in Japan (Figure 1). In this image indicating coherence levels, the Chikugo River (top left) is easily visible as a result of its low coherence (dark) values in contrast to the surrounding bright urban areas. Compared with an optical view from Google Earth (Figure 2), highly vegetated and undeveloped areas correlate with lower coherence.
