Dr. Pinki Mondal, Senior Research Associate, Center for International Earth Science Information Network (CIESIN), Columbia University, Palisades, NY (Note: Starting in August 2018 Mondal will be an Assistant Professor, Department of Geography, University of Delaware, Newark, DE)
Research interests: Human-environment interactions with a specific focus on the sustainability of agricultural ecosystems, agricultural sensitivity to climate variability, adaptation strategies for smallholder farms, and the effects of national-level policies on forestry and conservation.
Research highlights: Counting the residents of the second most populous nation in the world is a daunting task, but one India has undertaken every 10 years since the late 1800s (as a British colony until 1947, then as an independent nation). The numbers from the 2011 Indian census reveal that almost 70% of the nation’s more than 1.2 billion inhabitants live in rural areas, with a majority of these rural residents engaged in agriculture.
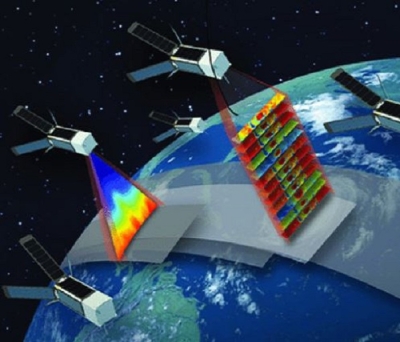
While the Census of India collects data at ground level showing where the population lives, instruments aboard Earth observing satellites constantly collect data showing how land is used. These remotely-sensed data are a foundation of Dr. Pinki Mondal’s studies into the sustainability of agricultural systems and the impacts of climate variability on agriculture in South Asia. Mondal currently conducts her research at CIESIN, which is the location of NASA’s Socioeconomic Data and Applications Center (SEDAC). SEDAC is an Earth Observing System Data and Information System (EOSDIS) Distributed Active Archive Center (DAAC), and supports the integration of socioeconomic and Earth science data in order to serve as an information gateway between the Earth sciences and social sciences.
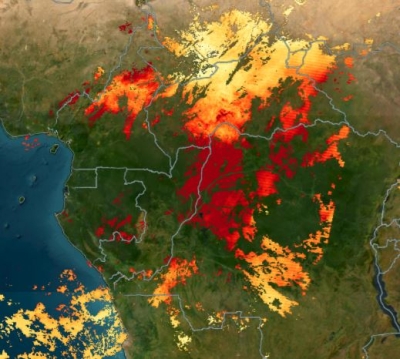
Satellite data can reveal a lot about the socioeconomic impacts of urbanization and environmental change, and help researchers more easily identify changes in landscape patterns across a wide range of spatial (local, regional, or continental) and temporal (week, month, or year) scales. For example, nighttime lights imagery from the Visible Infrared Imaging Radiometer Suite (VIIRS) make it easy to see the spread of urbanization into previously rural areas through changes in the density of human-added lights. Vegetation indices created from data collected by the Moderate Resolution Imaging Spectroradiometer (MODIS) aboard the Terra and Aqua satellites and by instruments aboard the joint NASA/U.S. Geological Survey’s (USGS) Landsat series of satellites enable researchers to more easily analyze changes in vegetation and spot patterns across entire continents. As Mondal notes, her research would be impossible without NASA Earth science data.

Mondal’s current research focuses on developing geospatial methods for monitoring smallholder agricultural systems in tropical countries. A “smallholder farm” generally is defined by both its physical size and its economic production, both of which are often small relative to other farms in a similar region. As a result, smallholder farmers can be impacted more significantly by changes in production caused by environmental factors including drought, flooding, and invasive species or by social factors like urbanization or state policies. In her research, Mondal uses microwave satellite data, Synthetic Aperture Radar (SAR) data (such as data from the European Space Agency’s Sentinel satellites), and high-resolution optical satellite data (such as from Landsat and Sentinel-2).
As Mondal notes, climate changes are expected to lead to significant fluctuations in crop yields and contribute to concerns about food security of the growing Indian population. She uses multi-platform satellite time-series data from MODIS, Landsat, and the joint NASA/Japan Aerospace Exploration Agency Tropical Rainfall Measuring Mission (TRMM),operational 1997-2015; along with district-level Indian census data for irrigation, dominant crop type, crop yield, and socioeconomic status to explore factors associated with changing crop covers.
Mondal also is interested in developing machine-learning algorithms that can convert socioeconomic and environmental data into geographic information system (GIS)-ready formats. The socioeconomic data used by Dr. Mondal are often obtained from national census or large-scale surveys and have millions of records at the finest administrative levels that require big data analysis. She integrates these data with satellite imagery to understand potential adaptation strategies of agricultural systems to climate change.
Her collaborative research on agricultural sensitivity to weather and climate variability in India has led to several interesting research findings. Along with the critical importance of daytime temperature to winter crops, she found that the sensitivity of crop productivity to climate variability is location-specific, and due primarily to differences in cropping practices throughout the year and irrigation access during the dry season. In addition, the sensitivity of crop productivity to precipitation depends on the irrigation source. For example, a longer wet season (monsoon) followed by higher temperatures in winter or a late and dry monsoon can severely limit the water available through surface irrigation, such as canals. These canals are a common irrigation source in Indian smallholder agricultural systems, so impacts to the water in these canals through changes in monsoon intensity or timing can significantly impact smallholder agricultural production.

Mondal points out that winter wheat, a staple and an important winter crop in India, requires timely irrigation. In research looking at strategies smallholder farmers can consider in dealing with the impacts of water and climate variability on the production of winter wheat and other winter crops, Mondal and her colleagues found that pulses, that is, crops harvested solely for their dry seed (such as dried beans, chickpeas, lentils, and peas), can be a potential alternative winter crop in the right type of soil. Other adaptation strategies include switching to crops less sensitive to heat, shifting the planting date for winter crops to avoid higher temperatures during the late-season grain maturing stage, and investing in research to develop early-maturing varieties of winter crops.
The combination of remotely-sensed data with census data provides a powerful tool for socioeconomic research and the application of this research to regions and economies that can be sensitive to climate variability. The research by Mondal and her colleagues seeks to provide a range of agricultural strategies so that the residents of these vulnerable areas can best prepare for potential future climate and environmental changes.
Representative data products used:
- Various SEDAC data sets:
- India Data Collection; co-developed by Mondal
- Global Summer Land Surface Temperature (LST) Grids, v1 (2013) (doi:10.7927/H408638T); developed by Mondal
- Global Urban Heat Island (UHI) Data Set, v1 (2013) (doi 10.7927/H4H70CRF); co-developed by Mondal
- Global Reservoir and Dam (GRanD-v1), Dams v1.01 (2011) (doi:10.7927/H4N877QK)
- Global Rural-Urban Mapping Project (GRUMP-v1), Urban Extents Grid, v1 (1995) (doi:10.7927/H4GH9FVG)
- MODIS land data products; available through the Land Processes Distributed Active Archive Center (LP DAAC):
- Enhanced Vegetation Index (EVI) and Normalized Difference Vegetation Index (NDVI) from Terra (MOD13Q1; doi:10.5067/MODIS/MOD13Q1.006) and Aqua (MYD13Q1; doi:10.5067/MODIS/MYD13Q1.006)
- Terra Land Surface Temperature (LST) (MOD11A2; doi:10.5067/MODIS/MOD11A2.006)
- TRMM daily precipitation product (TRMM_3B42RT_Daily; doi:10.5067/TRMM/TMPA/DAY-E/7); available through the Goddard Earth Sciences Data and Information Services Center (GES DISC)
- Sentinel-1 SAR Level 1 Ground Range Detected (GRD) imagery; available through the Alaska Satellite Facility DAAC (ASF DAAC)
- Landsat Tier-1 Precision Terrain (L1TP) products; available through the USGS
Read about the research:
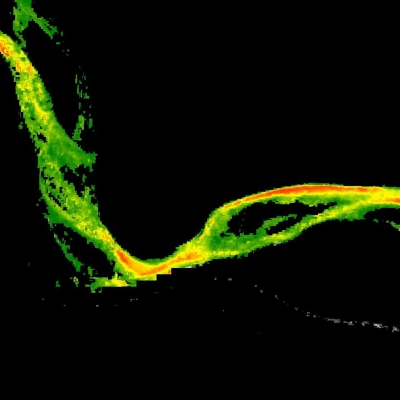
Mondal, P., Trzaska, S. & de Sherbinin, A. (2018). Landsat-derived estimates of mangroves in the Sierra Leone Coastal Landscape Complex during 1990-2016. Sensors, 18(1): 12. doi:10.3390/s18010012
Jain, M., Mondal, P., Galford, G., Fiske, G. & DeFries, R. (2017). An Automated Approach to Map Winter Cropped Area of Smallholder Farms across Large Scales Using MODIS Imagery. Remote Sensing, 9(6): 566. doi:10.3390/rs9060566
Mondal, P., Jain, M., Zukowski, M., Galford, G. & DeFries, R. (2016). Quantifying fluctuations in winter cropped area in the Central Indian Highlands. Regional Environmental Change, 16: 69-82. doi:10.1007/s10113-016-0946-y
Mondal, P., Jain, M., DeFries, R., Galford, G. & Small, C. (2015). Sensitivity of crop cover to climate variability: Insights from two Indian agro-ecoregions. Journal of Environmental Management, 148: 21-30. doi:10.1016/j.jenvman.2014.02.026
Mondal, P., Jain, M., Robertson, A., Galford, G., Small, C. & DeFries, R. (2014). Winter crop sensitivity to inter-annual climate variability in central India. Climatic Change, 126: 61-76. doi:10.1007/s10584-014-1216-y
For more information
- Visible Infrared Imaging Radiometer Suite (VIIRS)
- Moderate Resolution Imaging Spectroradiometer (MODIS)
- Tropical Rainfall Measuring Mission (TRMM)