In 1890, traveling on a steamer for a Belgian trading company, a young Joseph Conrad pierced the heart of darkness. As the mighty brown current of the Congo River uncoiled, he drifted into the depths of a colossal jungle that dripped with steam and glistened under the sun. Dense vegetation unfurled. “[It stood] higher than the wall of a temple,” he would later write in his novella, Heart of Darkness, in which nature is as much revered as it is suspect. The tale, set in the Congo Rainforest and centered on an isolated ivory trading post, is steeped with the horrors Conrad witnessed, securing his disillusionment with imperialism.
More than a century later, the region still struggles against the avarice of exploiters ready to strip the rainforest of minerals, ivory, and oil. “The region’s political instability continues to be a reason we’ve had to depend on satellite observations,” said Philippe Ciais, a scientist at the Laboratoire des Sciences du Climat et de l’Environnement in France. Unlike the Amazon rainforest, the Congo rainforest lacks in situ observations and resources for field study. Any first-hand accounts are precious.
Conrad described the Congolese foliage as “so dark-green as to be almost black.” But the mighty jungle, according to a recent study, shows that deep green beaten back not by man, but by drought.

Beyond the spotlight
Halfway around the world, the Amazon rainforest experienced severe drought in 2005 and 2010 with record low rainfall, drying tributaries, cracking soil, and collapsing trees. It got press. “We pay so much attention to the Amazon rainforest and so little to the African rainforest,” said Liming Zhou, a researcher at University at Albany. Though effectively less dramatic, an earlier study, examining precipitation rates from 1960 to 1998, alerted Zhou to a decades-long drought in the Congo Basin. Zhou then analyzed gauge and satellite data from 1950 to 2012 and found persistent drying beginning in 1985. Rainfall also reached its lowest levels in the last decade. No trees came crashing down, but Zhou wanted to know if the thirty-year drought had an effect. “This is the first study to link long-term drought to tropical rainforests,” Zhou said.
The Congo rainforest shelters all species of gorilla, the bonobo—a more-peaceful, pygmy cousin of the chimpanzee—the forest elephant, and the shy okapi. It is home to more than 10,000 species of tropical plants, with 30 percent unique to this region. Large herbivores, feeding on smaller trees, shape a canopy of thicker and taller trees than in the Amazon rainforest. Between 250,000 to 600,000 indigenous people live here. The Congo basin stands as the second largest rainforest after the Amazon; it spans six countries, and contains a quarter of the world’s remaining tropical forest. So a drop in plant photosynthetic capacity, even a minor one, would have implications on local biodiversity and the global carbon cycle.

“Before our study, some suggested the African rainforest may be insensitive to drought,” Zhou said. With higher altitudes and more semi-evergreen trees, the Congo rainforest is cooler than the Amazon rainforest. It is also drier. “Researchers thought maybe it already adapted to a drier climate,” Zhou added.
Short, intense droughts lasting less than six months are easy to detect. Rivers dry up. Vegetation shrivels and dies, resulting in erosion and dust bowls. Odds for fire increase. Longer-term droughts, technically more than six months—but stretching into decades—exhibit subtler effects that last longer and are potentially harder to reverse. Land may sink from parched aquifers. Coastal regions may suck saltwater inland. In the case of the Congo, the full effects are yet to be determined, but the rainforest is beginning to take notice.
Using data from several satellites, primarily covering 2000 to 2013, Zhou and his colleagues analyzed a region in the Congo Basin with a low deforestation rate. Specifically, the team analyzed vegetation greenness data, a way to measure the health of plants and trees. Simply put, was the forest responding to the drought, and if so, how?
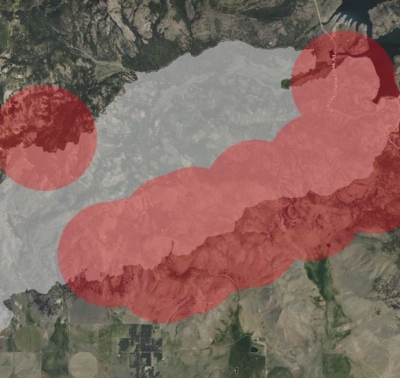
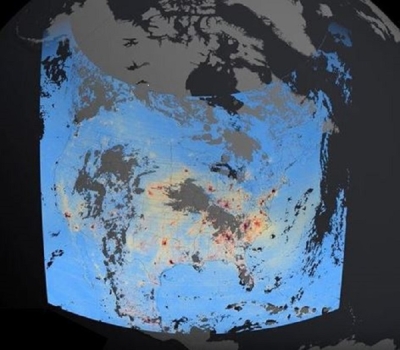
“No one has done a focused analysis like this,” said Ciais, who helped analyze the data. “Seeing the data was surprising.” Vegetation greenness experienced widespread decline. Patches of brown splattered throughout satellite images. The sensor at the center of it all is called the Moderate Resolution Imaging Spectroradiometer (MODIS). It flies on the NASA Terra satellite, able to capture and measure both plant growth and atmosphere and cloud properties on a global scale.
The science of green

By observing different wavelength absorptions versus reflections, scientists are able to quantify plant photosynthetic capacity. The more visible light is absorbed, the busier the plant. Chlorophyll, a green pigment within plants, is an agent in photosynthesis. Visible light feeds photosynthesis, transforming light energy into a sugar that further releases energy through its consumption. Virtually all energy used by a living organism stems from this transformation of sunlight to sugar.
Browning occurs when plants are stressed by a lack of water. The plump water cells within leaves wither, and the plant becomes less productive. If the stress is beyond some threshold, trees may even drop their leaves. But what is that threshold?
The Normalized Difference Vegetation Index (NDVI) is an algorithm that uses the different wavelengths of light reflected by vegetation to map the greenness of the world. Zhou’s study also used the MODIS-based Enhanced Vegetation Index (EVI) with its finer detail, making it more sensitive to differences within dense vegetation. The team focused on a three-month period from April to June, peak rain and growing seasons, because it shows the highest percentage of high-quality EVI pixels and the least cloud obstruction. From 2000 to 2012, EVI declined over 92 percent of the studied area, with about 40 percent showing a significant negative trend.
To make sure the results were sound, Zhou used multiple satellites. “It’s good to get field observations to see what is happening but in this case we can’t,” Zhou said. “So we used lots of satellites. Each kind of remote sensing technology is different, so you can look at the same area with different information.”

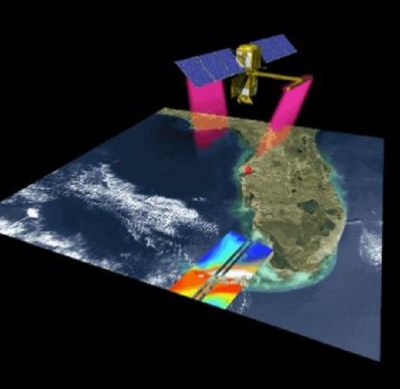
NASA's Tropical Rainfall Measuring Mission (TRMM), a sensor that monitors tropical precipitation, verified a decline in rainfall for the thirteen-year period. But even with less water coming down, could the rainforest adapt in how it stores and accesses water? Could deep roots even reach ground water? To check, the scientists turned to another mission, NASA's Gravity Recovery and Climate Experiment (GRACE), twin satellites that detect gravity anomalies by sensing subtle changes in Earth’s mass. Using GRACE data, Zhou calculated total water storage changes in the area’s wetlands, rivers, ground water, and soil moisture to determine where the storage changed. GRACE confirmed a decline in groundwater levels, further stressing plant productivity.
From the ground up, Zhou shifted to the atmosphere. Cloud cover and aerosol particles influence the rate of photosynthetic productivity. To assess these changes, Zhou used MODIS aerosol optical thickness (AOT) and cloud optical thickness (COT) values. AOT measures the degree of solar light interference. Higher aerosols result in lower visibility and less sunlight reaching vegetation. COT determines the thickness or transparency of cloud cover. Could a change in either confirm drought? From 2000 to 2012, AOT barely changed, but COT showed significant decrease. With thinner clouds, more unobstructed sunlight touches the surface. More sunlight is good for photosynthesis, but the process also transpires water out. A boost in transpiration may empty all moisture out of the soil, causing another level of stress on vegetation.

Another pair of eyes
The persistent browning of the Congolese forests may reflect a slow adjustment to the long-term drying trend. It is nature’s way of coping. In the short-term, proper rainfall offers recovery. “But long-term drought will likely change the structure and composition of the forest,” Zhou said. For example, species in the Ghanaian forest shifted from wetter vegetation to favor deciduous trees and a drier canopy after a twenty-year drought.
But detection of such impacts requires long-term ground observations, similar to the Amazon. “People can’t expect North American researchers to study the Amazon rainforest or European researchers to study the African rainforest,” Ciais said. “In the end, it has to be local entities that take charge of field observations.” The political situation continues to undermine much-needed science. For instance, Africa’s oldest national park, the Virunga National Park, battles with political instability and foreign corporations. In the last twenty years, the park has lost more than 150 rangers protecting one of the largest mountain gorilla populations. For the Congo Basin to be better understood, scientists need to be able to make proper field observations, but that can only happen when the political situation offers the African people security.
“Though we don’t have ground observations, the satellite data shows almost everything is impacted,” Zhou said. With climate models shaping a future with more frequent droughts, the impact of browning on the carbon cycle and biodiversity conservation needs further study. “It should become a research priority,” Zhou added. Because as this study suggests, it is not a matter of whether the rainforests will respond, but more a question of how.

References
Jones, L. A. and J. S. Kimball. 2010, updated 2012. Daily Global Land Surface Parameters Derived from AMSR-E. Boulder, CO, USA: NASA National Snow and Ice Data Center (NSIDC) Distributed Active Archive Center (DAAC).
NASA Atmospheric Science Data Center (ASDC). 2003-2012. Clouds and the Earth’s Radiant Energy System (CERES) SYN1 deg_Ed3a. Hampton, VA, USA.
NASA Goddard Earth Sciences Data and Information Services Center (GES DISC). 1998-2012. Tropical Rainfall Measuring Mission (TRMM) Multi-Satellite Precipitation Analysis. Greenbelt, MD, USA.
NASA Land Processes Distributed Active Archive Center (LP DAAC). 2000-2012, monthly. MODIS Vegetation Indices MOD13C2. USGS/Earth Resources Observation and Science (EROS) Center, Sioux Falls, SD, USA, doi:10.5067/MODIS/MOD13C2.006.
NASA Land Processes Distributed Active Archive Center (LP DAAC). 2003-2012, monthly. MODIS Land Surface Temperature and Emissivity MYD11C3. USGS/Earth Resources Observation and Science (EROS) Center, Sioux Falls, SD, USA, doi:10.5067/MODIS/MYD11C3.006.
NASA Land Processes Distributed Active Archive Center (LP DAAC). 2001-2012, yearly. MODIS Land Cover Type MCD12C1. USGS/Earth Resources Observation and Science (EROS) Center, Sioux Falls, SD, USA, doi:10.5067/MODIS/MCD12C1.006.
NASA Level 1 and Atmosphere Archive and Distribution System (LAADS) Distributed Active Archive Center (DAAC). 2002-2012, monthly. MODIS/Gridded Atmospheric Product MOD08_M3. Greenbelt, MD, USA, doi:10.5067/MODIS/MOD08_M3.006.
Swenson, S. C. 2012. GRACE Monthly Land Water Mass Grids NETCDF Release 5.0. Ver. 5.0. PO.DAAC, CA, USA. doi:10.5067/TELND-NC005.
Zhou, L., Y. Tian, R. B. Myneni, P. Ciais, S. Saatchi, Y. Y. Liu, S. Piao, H. Chen, E. F. Vermote, C. Songe, and T. Hwang. 2014. Widespread decline of Congo rainforest greenness in the past decade. Nature 509: 86-90, doi:10.1038/nature13265.
For more information
NASA Land Processes Distributed Active Archive Center (LP DAAC)
NASA Level 1 and Atmosphere Archive and Distribution System DAAC (LAADS DAAC)
NASA Goddard Earth Sciences Data and Information Services Center (GES DISC)
NASA Physical Oceanography DAAC (PO.DAAC)
NASA Atmospheric Science Data Center (ASDC)
NASA National Snow and Ice Data Center DAAC (NSIDC DAAC)
| About the remote sensing data | |||||
| Satellites | Terra | Terra and Aqua | Tropical Rainfall Measuring Mission | ||
| Sensors | Moderate Resolution Imaging Spectroradiometer (MODIS) | MODIS | Precipitation Radar Microwave Imager |
||
| Data sets | Gridded Atmospheric Product (MOD08_M3) |
Vegetation Indices (MOD13C2) |
TRMM Multi-Satellite Precipitation Analysis | ||
| Resolution | 1 degree | 5.6 kilometer | 0.25 x 0.25 degree resolution | ||
| Parameters | Aerosol optical thickness Cloud optical thickness |
Normalized Difference Vegetation Index |
Precipitation | ||
| DAACs | NASA Level 1 and Atmosphere Archive and Distribution System Distributed Active Archive Center (LAADS DAAC) | NASA Land Processes DAAC (LP DAAC) | NASA Goddard Earth Sciences Data and Information Services Center (GES DISC) | ||
| About the remote sensing data | |||||
| Satellites | Gravity Recovery and Climate Experiment (GRACE) | Terra and Aqua | Aqua | ||
| Sensors | SuperSTAR Accelerometer Star Camera Assembly K-Band Ranging System |
Clouds and the Earth's Radiant Energy System (CERES) | Advanced Microwave Scanning Radiometer - Earth Observing System (AMSR-E) | ||
| Data sets | GRACE Monthly Land Water Mass Grids (CSR) | SYN1deg_Ed3a | Daily Global Land Surface Parameters Derived from AMSR-E | ||
| Resolution | 1 degree | 1 degree | 25 kilometer | ||
| Parameters | Terrestrial water storage anomalies | Radiative flux | Canopy microwave transmittance | ||
| DAACs | NASA Physical Oceanography DAAC (PO.DAAC) | NASA Atmospheric Science Data Center (ASDC) | NASA National Snow and Ice Data Center DAAC (NSIDC DAAC) | ||