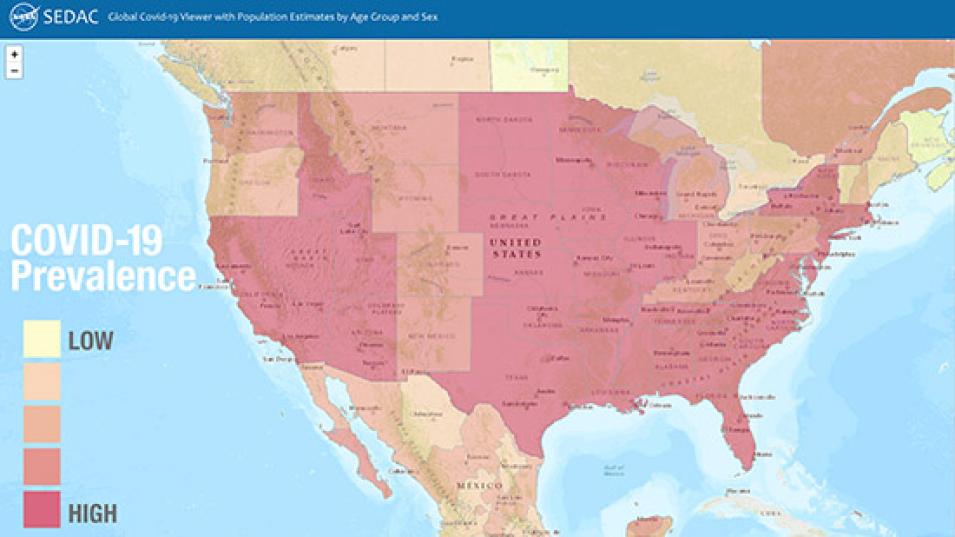
The latest update to the Global COVID-19 Viewer: Population Estimates by Age Group and Sex features enhanced capabilities for visualizing the status and reach of the pandemic around the world, daily and over time since its beginning, and to identify at-risk populations. A pop-up trends graph illustrates daily and 7-day moving averages of COVID-19 cases and deaths for a range of select time scales—one month, three months, six months, and beyond. The graph may be accessed by simply clicking on a country.
Updated COVID-19 Map Viewer Shows Daily and 7-Day Trends at a Glance
The Global COVID-19 Viewer, developed by SEDAC, can display population estimates by age group and sex.
User-friendly mapping tools let users define a custom area or fly to a location of interest. Users may also easily move up or down administrative levels in many countries and view demographic and urbanization estimates relevant to possible risk factors for the virus. The Global COVID-19 Viewer was developed by NASA's Socioeconomic Data and Applications Center (SEDAC), managed by Columbia University’s Center for International Earth Science Information Network (CIESIN). The underlying population data are from SEDAC's Gridded Population of the World (GPW) Basic Demographic Characteristics, v4.11, for the year 2010, with estimates to 2020. The COVID-19 data are from Johns Hopkins University & Medicine Coronavirus Resource Center.
Details
Last Updated
Published
Sept. 25, 2020
Data Center/Project
Socioeconomic Data and Applications Center (SEDAC)
