Tracking Survival Among Idaho's Mule Deer

Satellite sensing of summer plants and winter snow helps biologists predict mule deer populations.

During the winter of 2016 to 2017, storm after storm blasted Idaho, piling the state’s snowpack far above average. Areas that received more than twice the usual amount of snowfall buried plants and bushes, starving wildlife. Only 30 percent of Idaho’s mule deer fawns survived, about half the usual number. Across the western United States, brutal winters like this kill vulnerable does and fawns, decreasing the following year’s population. Even worse, these drops exacerbate an ongoing decline in mule deer numbers.

This decline is troubling, because mule deer are critical to many of the West’s biomes. “Mule deer are an indicator of healthy, functioning wild ecosystems,” said Mark Hebblewhite, a wildlife biologist at the University of Montana. Traditionally, biologists monitor mule deer by capturing a small number of the animals every year and fitting them with radio collars that track them, sometimes until death. However, that method is expensive and time consuming. Hebblewhite and Mark Hurley, a colleague at the Idaho Department of Fish and Game, wanted to find an easier way.

Biologists in Idaho have been radio collaring and monitoring mule deer for nearly twenty years, and the resulting data suggested fawn survival was key to maintaining mule deer populations. Yet fawn survival remained highly unpredictable. What if the researchers could instead track predictors within the ecosystems themselves? “We started looking for ways of measuring habitat- and weather-derived influences on mule deer in different parts of Idaho,” Hebblewhite said, hoping to glean environmental predictors from satellite data. Could distant satellites help them estimate the survival of thousands of tiny fawns?
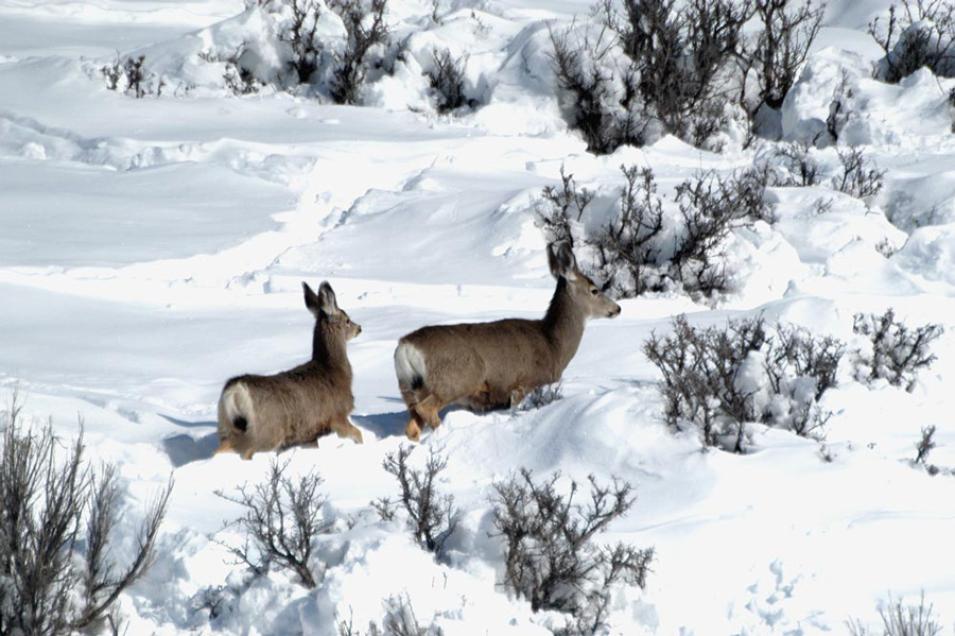
Photograph of a mule deer doe and fawn trudging through deep snow in Idaho
Image Caption

A mule deer doe and her fawn trudge through deep snow in Idaho. (Courtesy Idaho Department of Fish and Game)

Fragile fawns

Named for their large, mule-like ears, mule deer inhabit unforgiving environments, ranging from the high deserts of Mexico to rugged alpine peaks in the Yukon. Although mule deer will eat grass, they mostly browse, biting the leaves off of trees and shrubs, and nibbling flowers and leafy plants. “In most of the semi-arid and western United States, mule deer are the dominant large herbivore,” Hebblewhite said. As they roam and feed, mule deer leave behind seed-filled droppings that replenish native forests and grasslands, strengthening native ecosystems. In turn, mule deer are preyed on by mountain lions, bears, wolves, coyotes, and even humans, feeding carnivores further up the food chain.

In Idaho, even during the best of years, mule deer race against time to fatten up for winter. “They try to gain a lot of fat during the summer and fall to make it through the winter,” Hurley said. During harsh winters, deer resort to nipping lichen from rock faces or chewing bark off trees. Otherwise, adult deer survive the winter by living off their accumulated fat reserves. Fawns do not have that luxury.

Fawns born in early summer must eat enough to triple in size before winter. But this does not give them enough time to produce adequate fat reserves. “They’re always going into winter in substandard conditions,” Hurley said. The quantity and quality of what mule deer eat is only one factor; severe winter weather introduces another complication. Although fawns are weaned by fall, they remain with their mother throughout the winter, learning to find food. Long, snowy winters deplete an adult mule deer’s fat reserves; slogging through belly-deep snowpack month after month can starve fawns lacking those reserves.

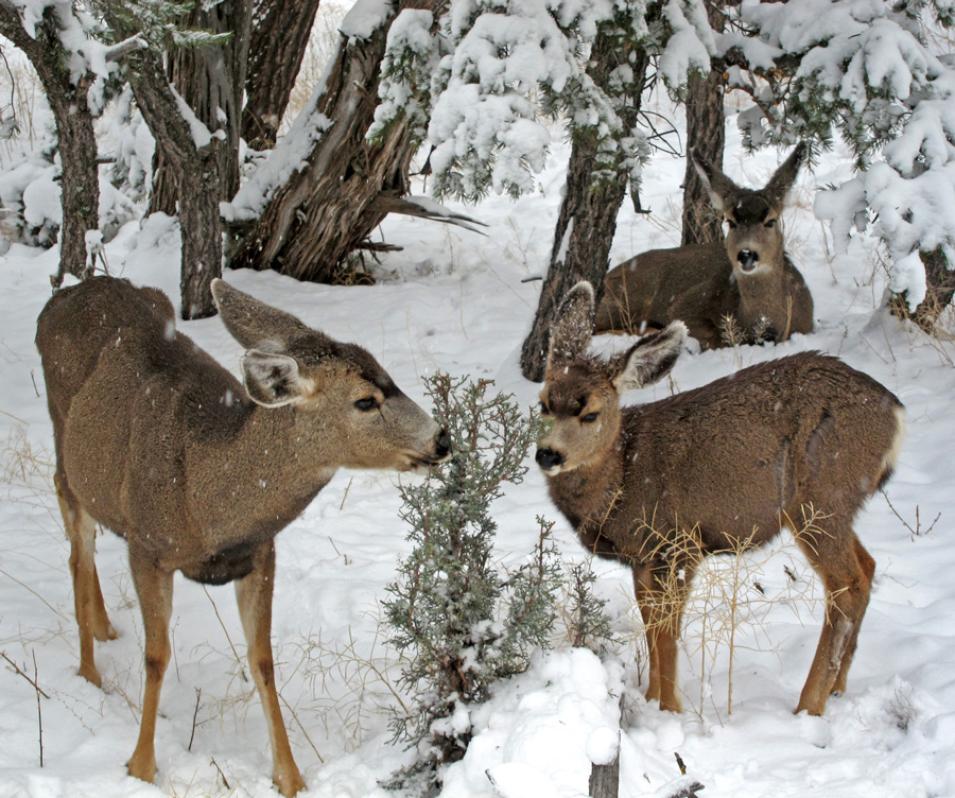
Photograph of mule deer nibbling on a small juniper tree
Image Caption

Even the high deserts of Arizona experience winter, and mule deer here often feed on evergreen juniper trees that poke above the snowpack. (Courtesy Grand Canyon National Park)

Finding the predictors

Between 2003 and 2013, biologists working with the Idaho Department of Fish and Game radio collared and tracked 2,529 fawns, recording survivals and deaths across central and southern Idaho. The geographic range covered three major climatic ecotypes that mule deer inhabit: conifer, aspen, and shrub-steppe. With fawn data in hand, the team gathered various vegetation and snow data to see if any stood out as factors for survival. “It was our search for the best predictors,” Hurley said. “What really is influencing fawn survival?”

Because the quality of summer and fall forage matters for deer survival, the researchers relied on a satellite sensor that can measure annual vegetation growth, providing a proxy for ideal deer habitat. Launched in 1999 on NASA's Terra satellite, the Moderate Resolution Imaging Spectroradiometer (MODIS) instrument accrued a time series of data matching the radio collar time span. These vegetation data at 250-meter resolution, spanning March 15 through November 15 annually, captured each growing season from the first tender buds of spring through the last yellowing leaves of autumn.

For winter snow conditions, the researchers encountered a challenge. “These deer live in fairly steep country,” Hurley said. “You have quite an elevation change within a one-kilometer pixel.” Snow does not blanket a mountain range uniformly, and snow cover varies dramatically from peak to valley, or from one mountain face to another. Lower-resolution data could not map such distinctions. The team tried several products before finding success with the finer resolution of MODIS 500-meter snow cover data, which captured subtler differences in terrain and snowpack.

The team developed eleven different models, combining the radio collar record and satellite data. To indicate winter severity, they focused on snow cover and snow depth in early winter, midwinter, and late winter. Spring and fall vegetation quality represented fat reserves heading into winter. Some of the models were simple, including only a few variables, while others included up to seven. After analysis, Hurley and his colleagues discovered the simplest models were often the most accurate. Early winter severity combined with fall forage quality seemed to best predict fawn survival. Hebblewhite said, “Our models stunned us at how well they predicted.” Better yet, the team included early prediction models, which revealed these predictors held true even if the model only included data for early winter. Hurley said, “That seems to be a very nice predictor of what survival is going to be through the rest of the winter.”

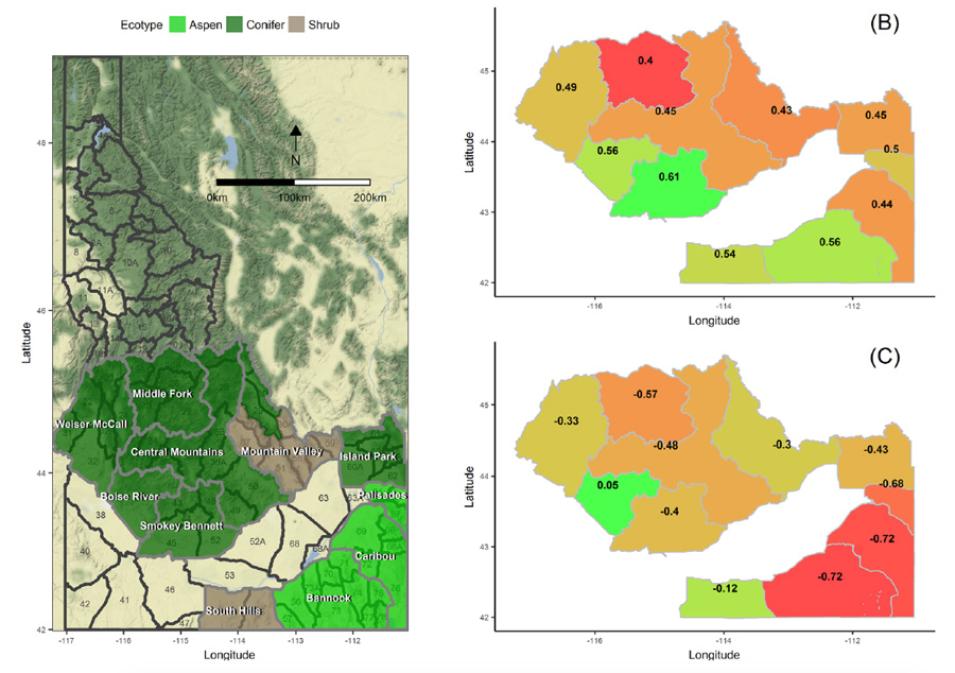
Data image showing mule deer habitats and survival rates
Image Caption

Map A illustrates the three most common mule deer habitats: conifer, aspen, and shrub-steppe. Map A also shows Game Management Units (GMUs) in black boundaries and larger-scale Population Management Units (PMUs) in grey boundaries. Map B shows estimated overwinter survival of mule deer fawns, and map C shows how much snow cover affected fawn survival. For maps B and C, green colors indicate winters during which mule deer are more likely to survive and orange to red colors indicate winters the deer are less likely to survive. Normalized Difference Vegetation Index and snow data are from the Moderate Resolution Imaging Spectroradiometer (MODIS) sensor aboard the NASA Terra satellite. (Courtesy M. Hurley, et al., 2017, The Journal of Wildlife Management)

Better models, better management

For the models to be useful, they had to be integrated into the Idaho Department of Fish and Game’s management process. Across the West, states rely on hunting to help manage and conserve wildlife. The risks of overharvesting species are severe, so getting these models to game managers was critical, and timing was the catch. The Idaho department releases each year’s autumn hunt quotas in March, even though traditional radio-collared population tracking is not complete until summer. Incorporating the early prediction models meant managers could set harvest limits for the upcoming year as early as January, eliminating that lag time. Better herd management boosts a state’s bottom line, since most states fund their conservation programs by selling hunting licenses. During 2016 fiscal year, Idaho collected nearly $40 million dollars in hunting and fishing license sales. Healthy, well-managed species mean more revenue.

Hurley and Hebblewhite worked with colleagues Paul Lukacs and Josh Nowak at the University of Montana in Missoula to develop an application to automate and run the models. The resulting application, which the team named PopR, allows game managers to project future mule deer populations. “They can download the NASA data, prepare the variables, and run the survival prediction models within this PopR software,” Hurley said. By adjusting snowpack, fall forage, or harvest quotas, game managers can see whether the number of mule deer will grow or decrease.

Collaborating with local biologists was key to PopR’s success. Hebblewhite said, “We achieved buy-in through face-to-face workshops and training sessions and lots of one-on-one meetings.” Creating a portable tool that displays population projections in real time also made it much easier for game managers to explain their decision-making process to the public. According to Hebblewhite, an Idaho manager can bring up department data that are being analyzed with the models and pull in MODIS data distributed by NASA's Land Processes Distributed Active Archive Center (LP DAAC) and National Snow and Ice Data Center (NSIDC) DAAC. “They can display it right on their phone in public fish and game commission meetings,” he said.

Prior to the 2016 to 2017 winter, Idaho’s mule deer populations were on the rise, which helped cushion that winter’s fawn deaths. The Idaho Department of Fish and Game used PopR for the first time in 2016 to track mule deer populations and set hunt quotas. For the 2017 to 2018 hunting season, game managers reduced the number of mule deer doe licenses in southern and central Idaho game units to help the herds rebound. PopR is designed to be portable and flexible, and is also being used by South Dakota and Montana to manage game. The researchers expect more states to adopt PopR in the future. “That’s why PopR is pretty exciting,” Hurley said. “It’s our charge to understand population dynamics. PopR allows us to answer those ecology questions beyond just management.”

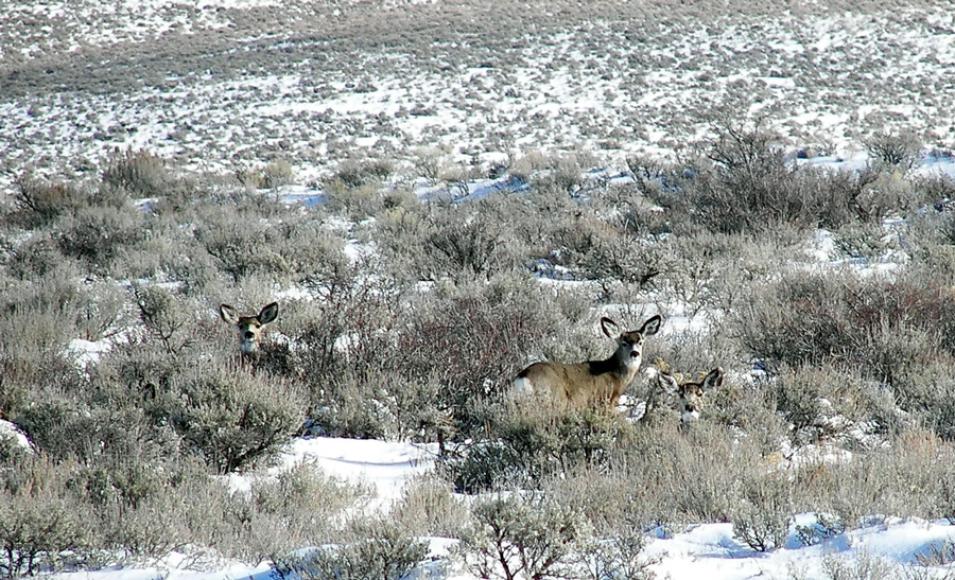
Photograph of mule deer in the sage flats of southern Idaho
Image Caption

Mule deer are named for their large, mule-like ears. These mule deer are feeding along the sage flats in southern Idaho. (Courtesy Jess Johnson/Flickr)

For more information

NASA Land Processes Distributed Active Archive Center (LP DAAC)

NASA National Snow and Ice Data Center DAAC (NSIDC DAAC)

NASA Moderate Resolution Imaging Spectroradiometer (MODIS)

Idaho Department of Fish and Game

W. A. Franke College of Forestry and Conservation, University of Montana

References

Hall, D. K. and G. A. Riggs. 2006. MODIS/Terra Snow Cover 8-Day L3 Global 500m Grid, Version 5, Boulder, CO, USA. NASA National Snow and Ice Data Center Distributed Active Archive Center. doi:10.5067/C574UGKQQU1T.

Hebblewhite, M., M. Hurley, P. Lukacs, and J. Nowak. In press. Predicting mule deer (Odocoileus hemionus) harvest in real-time: Integrating satellite remote-sensing measures of forage quality and climate in Idaho. In Satellite Remote Sensing for Conservation Action, eds. A. K. Leidner and G. M. Buchanan. Cambridge: Cambridge University Press.

Hurley, M. A., M. Hebblewhite, P. M. Lukacs, J. J. Nowak, J.-M. Gaillard, and C. Bonenfant. 2017. Regional-scale models for predicting overwinter survival of juvenile ungulates. The Journal of Wildlife Management 81(3): 364-378. doi:10.1002/jwmg.21211.

Didan, K. MOD13Q1 MODIS/Terra Vegetation Indices 16-Day L3 Global 250m SIN Grid V005. 2015, distributed by NASA EOSDIS Land Processes DAAC, USGS Earth Resources Observation and Science (EROS) Center, Sioux Falls, SD. https://lpdaac.usgs.gov/products/mod13q1v006/

National Operational Hydrologic Remote Sensing Center. 2004. Snow Data Assimilation System (SNODAS) Data Products at NSIDC, Version 1. Boulder, CO, USA. NSIDC: National Snow and Ice Data Center. https://nsidc.org/data/g02158.

Nowak, J. J., P. M. Lukacs, M. A. Hurley, A. J. Lindbloom, K. A. Robling, J. A. Gude, and H. Robinson. 2017. Customized software to streamline routine analyses for wildlife management. Wildlife Society Bulletin. doi:10.1002/wsb.841.

About the remote sensing data
Satellite Terra Terra
Sensor Moderate Resolution Imaging Spectroradiometer (MODIS) MODIS
Data sets

MOD13Q1 MODIS/Terra Vegetation Indices 16-Day L3 Global 250m SIN Grid V005

MOD10A2 MODIS/Terra Snow Cover 8-Day L3 Global 500 m Grid, Version 5

Snow Data and Assimilation System (SNODAS) Data Products at NSIDC, Version 1

Resolution 250 meter 500 meter 30 arc seconds
Parameters Normalized Difference Vegetation Index (NDVI) Snow cover extent Snow cover, snow water equivalent
DAACs NASA Land Processes Distributed Active Archive Center (LP DAAC) NASA National Snow and Ice Data Center (NSIDC DAAC) NASA NSIDC DAAC

Details

Last Updated

Published

Data Center/Project

Land Processes DAAC (LP DAAC)
National Snow and Ice Data Center DAAC (NSIDC DAAC)