Not So Big, Not So Hot

Yellowstone is a kind of tutorial for volcano monitoring.

Yellowstone National Park puts on a thrilling show. Geysers steam and spout, steam vents hiss, mudpots spew, and hot springs color their waters with intense yellows, blues, oranges, and greens. Visitors soon learn they are standing on a volcano that has not erupted for about 70,000 years, but still could.

Preventing volcanoes from erupting is beyond human control, but scientists can monitor for the signs of a coming eruption. Changes in heat may be one of those signs. “Yellowstone is one of the places where Earth is letting out a lot of its internal heat,” said Greg Vaughan, a U.S. Geological Survey (USGS) researcher who has studied Yellowstone. All of this hot action on the surface can be read as a report on the restless lava and pressures far below ground.

An eye to the surface

People like to talk about the potential for a massive eruption at Yellowstone, wiping out the park and large areas of the three states it straddles, but scientists say that is unlikely. “There have been some very big eruptions there in the past, but many more that were not as big. If there were ever to be another eruption in Yellowstone, it is more likely to be one of those not-so-super eruptions,” Vaughan said.

Yellowstone, like some other active volcanoes, is monitored by a group of scientists who watch for signals that precede eruptions. They use ground instruments to monitor Yellowstone’s 1,000 to 3,000 annual earthquakes, and both ground and satellite observations to spot bulges or subsidence on the surface that indicate magma or hot fluids moving underground, like gophers burrowing under your lawn.

Thermal features like Old Faithful’s clockwork eruptions also hint of the hot magma that causes groundwater to spout boiling plumes into the air. Yet most of Yellowstone’s thermal features are less consistent or stable than Old Faithful. “The National Park Service (NPS) monitors these features and how they change,” Vaughan said. “They disappear and move around. New ones pop up where they have never been before. The NPS needs to understand how this ever-changing thermal activity affects visitor safety, and park infrastructure—for example, if they are going to build a new road.”

Vaughan is interested in what changes in thermal activity can say about volcanoes. “Thermal anomalies often precede eruptions, but it is usually after the fact that we realize this,” he said. While the park has placed sensors at some locations, it is impossible to monitor on foot Yellowstone’s more than 10,000 geothermal features spread over 3,472 square miles. Most volcanoes in the world are not monitored, nor do they sit within a popular park. They may have limited or no instrument networks to alert scientists of their growing wrath. “For a lot of volcanoes, a satellite image might be the first indication of an eruption,” Vaughan said.
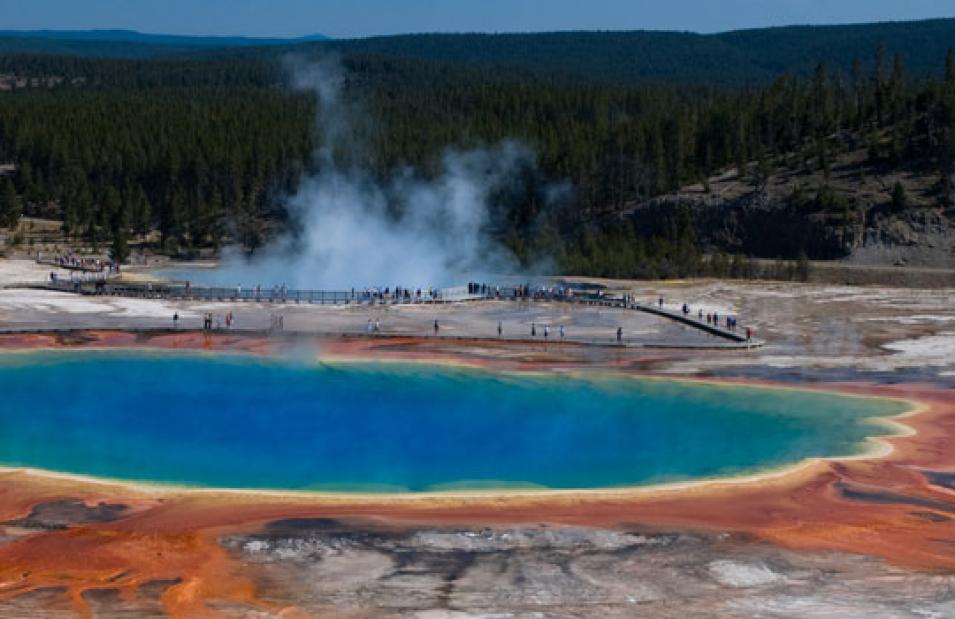
Photograph of Grand Prismatic Spring in Yellowstone National Park
Image Caption

Thermophilic bacteria give Grand Prismatic Spring in Yellowstone National Park its many hues. (Courtesy A. Mancia)

Heat and space

Thermal infrared satellite images have long been used to detect volcanoes erupting in remote, unmonitored locations. When Redoubt Volcano in the Aleutian Islands erupted in 2009, scientists used infrared data from the Moderate Resolution Imaging Spectroradiometer (MODIS) instrument and other sensors to monitor, in near-real time, the heat that signaled the growth, collapse, and cooling of the lava dome within Redoubt’s crater.

More recently, researchers have been looking at changes in surface heat that can be a precursor to an eruption. Rick Wessels at the Alaska Volcano Observatory (AVO) said that satellite monitoring of thermal activity can be useful in cool climates, where the heat of the thermal features stands out against a cold background. “This method works when you have such a good temperature contrast,” Wessels said. “It doesn’t work in the tropics, where thermal activity is such a small feature on an already warm background.”

After the Redoubt eruption, Wessels looked back through satellite data for thermal signals before the eruption. “With Redoubt, we were able to see slight hints going on in midwinter, but we didn’t catch it at the time. We saw it later, going back through ten months of data,” he said. He retrieved data from clear winter nights, which provide the best thermal contrast, from the Advanced Spaceborne Thermal Emission and Reflection Radiometer (ASTER) on NASA’s Terra satellite, distributed by NASA's Land Processes Distributed Active Archive Center (LP DAAC). ASTER picked up subtle anomalies in the surface temperature of Redoubt’s crater a few months before the eruption.

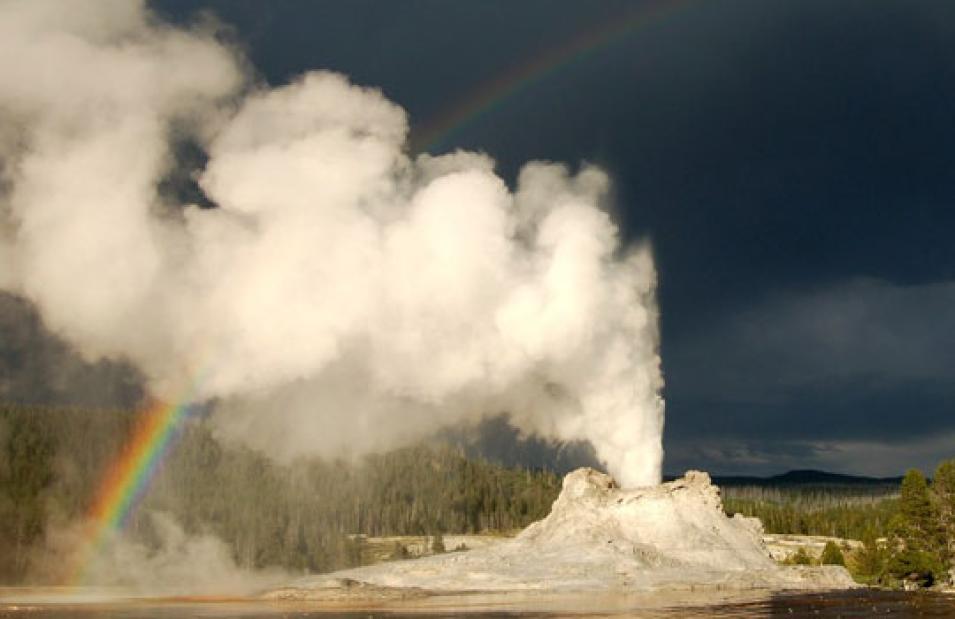
Castle Geyser in Yellowstone National Park
Image Caption

A rainbow stretches over Castle Geyser in the early evening. (Courtesy C. Tidball)

Hot and cold

Thermal monitoring is one more way to spot volcanoes that need watching, and to refine eruption predictions. Wessels said, “Most volcanoes give us a few weeks warning. We’ve successfully forecast pending eruptions and have been able to get people out of the way for the last ten to fifteen years.” The exact date of a coming eruption remains hard to figure, and narrowing that window would help emergency managers. “We’d like to be able to predict eruptions in the next few days rather than in the next few months,” he said.

Vaughan thought that Yellowstone would make a good case study for detecting thermal precursors of an eruption. Yellowstone’s high elevation, ranging from 5,000 to 11,000 feet, gives its thermal features that cool background, especially at night when the sun is not warming the surface. Still, Vaughan and his colleagues at the Park Service were looking at some relatively subtle features, at the scale of satellite imagery. Vaughan said, “Trying to detect thermal features that are not that hot, maybe just boiling, and that are small, pushes the limits of this method.”

The MODIS instrument, also on the Terra satellite, crosses most of Earth twice a day, once during the day and once at night. This high frequency of data is ideal for monitoring larger features, but not for small ones like geysers. Yellowstone’s thermal features range from a few centimeters to tens of meters across. MODIS thermal infrared pixels are 1,000 meters across. ASTER thermal infrared images have 90-meter pixels, but ASTER does not acquire data constantly, only on request.

Vaughan planned to use MODIS with its high frequency and coverage, but lower resolution, to measure the background temperatures of the Yellowstone area. This would give him data on normal surface temperatures in the area over the last decade. Subtracting this background from the thermal areas would help him distinguish the hot features from normal variations in temperature, caused for example by variations in snowpack, and to see more clearly where temperatures spiked from increased activity or new, unknown features. Using wintertime scenes helped increase the contrast even more. The research team was able to compare these thermal data to data from ground instruments and airborne studies.

Satellite image showing nighttime temperature at Heart Lake Geyser Basin, January 28, 2010
Image Caption

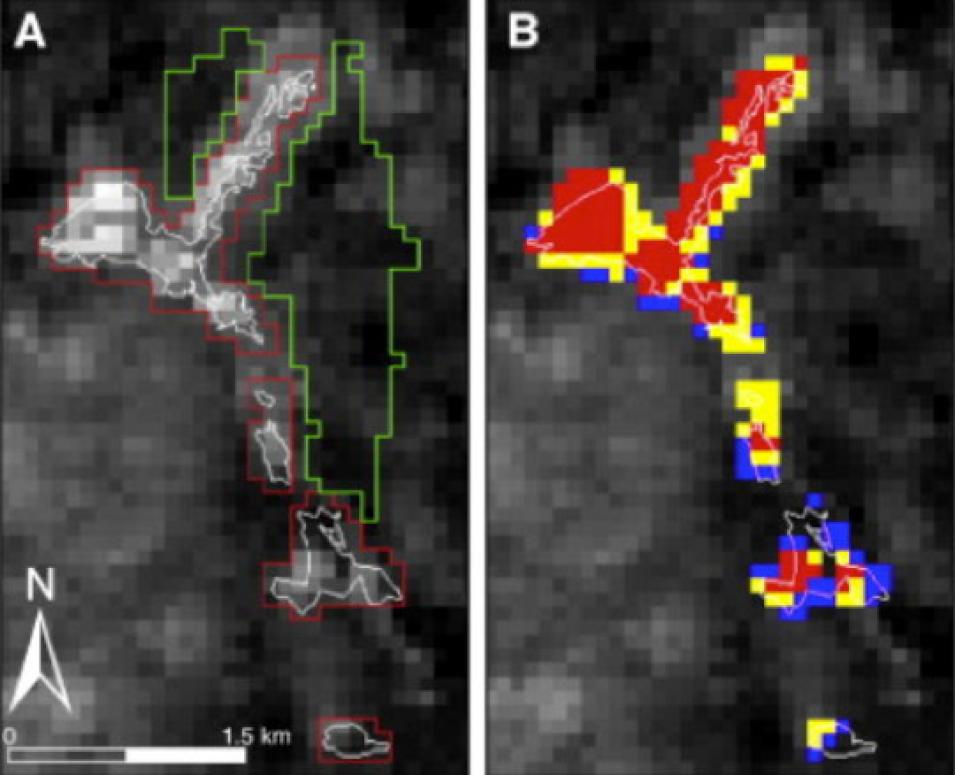
The figure at left from the Advanced Spaceborne Thermal Emission and Reflection Radiometer (ASTER) instrument shows nighttime temperature at Heart Lake Geyser Basin on January 28, 2010. The thermal areas are outlined in white; the ASTER pixel areas encompassing the thermal area are outlined in red. Non-thermal background temperature pixels are outlined in green. The figure at right shows how the thermal pixels vary from thermal background: blue pixels are average, yellow are two standard deviations greater, and red are four standard deviations greater. North is up; pixels are 90 meters resolution. (Courtesy R. G. Vaughan et al., 2012, Journal of Volcanology and Geothermal Research)

An eye on change

Still, Yellowstone’s features were so small, their impact to even an ASTER scene was subtle, like throwing a cup of boiling water into a swimming pool of cold water. Is the park heating up, cooling down, or staying the same? The heat data confirm that Yellowstone’s volcano is chugging steadily along. “Over the years we’ve been looking, there has not been any real change,” Vaughan said. “There are variations on a smaller scale, but for the park as a whole, no detectable thermal changes. That question is really only answerable over a longer time scale.” Yet the study provides a framework for monitoring changes in these subtle features, which might someday be automated to alert scientists when volcanoes stir.

More immediately, the results help Yellowstone’s park managers. “ASTER has been useful for assessing and updating maps of specific thermal areas in the park,” Vaughan said. “We found hot areas with ASTER that were not on the thermal area maps.”

With some luck humans will enjoy the wonders of Yellowstone for many generations, and it will continue to teach scientists too. Vaughan said, “Yellowstone has the largest concentration of thermal features in the world. They are not constant; they are changing. It’s important to monitor how they change, to protect resources and people.”

References

NASA Land Processes DAAC (LP DAAC). ASTER L1B data. Sioux Falls, South Dakota USA: USGS/Earth Resources Observation and Science (EROS) Center.

NASA MODIS Level 1 and Atmosphere Archive and Distribution System (LAADS) DAAC. MOD02 Level 1B Calibrated Radiances. Greenbelt, Maryland USA.

Vaughan, R. G., L. P. Keszthelyi, J. B. Lowenstern, C. Jaworowski, and H. Heasler. 2012. Use of ASTER and MODIS thermal infrared data to quantify heat flow and hydrothermal change at Yellowstone National Park. Journal of Volcanology and Geothermal Research 233–234: 72–89, doi:10.1016/j.jvolgeores.2012.04.022.

Wessels, R. L., R. G. Vaughan, M. Patrick, and M. Coombs. 2012. High-resolution satellite and airborne thermal infrared imaging of precursory unrest and 2009 eruption at Redoubt Volcano, Alaska. Journal of Volcanology and Geothermal Research 259: 248–269, doi:10/1016.j.volgeores.2012.04.014.

For more information

NASA Land Processes Distributed Active Archive Center (LP DAAC)

NASA Level 1 and Atmosphere Archive and Distribution System (LAADS DAAC)

Advanced Spaceborne Thermal Emission and Reflection Radiometer (ASTER)

Moderate Resolution Imaging Spectroradiometer (MODIS)

About the remote sensing data used
Satellites Terra Terra
Sensors Advanced Spaceborne Thermal Emission and Reflection Radiometer (ASTER) Moderate Resolution Imaging Spectroradiometer (MODIS)
Data sets ASTER Level 1B thermal infrared (TIR) data: AST_L1B radiometrically calibrated, geometrically corrected at-sensor radiance AST09T atmospherically corrected at-surface TIR radiance AST05 surface emissivity AST08 surface kinetic temperature data MOD02 Level 1B Calibrated Radiances MOD03 Geolocation
Resolution 90 meter 1 kilometer
Parameters Radiance Radiance, geolocation
DAACs NASA Land Processes Distributed Active Archive Center (LP DAAC) NASA Level 1 and Atmosphere Archive and Distribution System DAAC (LAADS DAAC)
ASTER emissivity data for various areas of Yellowstone were derived from the North American ASTER Land Surface Emissivity Database (NAALSED), available from LP DAAC.

The photograph in the title graphic shows steam rising from Upper Geyser Basin in Yellowstone National Park. (Courtesy Gabri_micha/flickr)

Details

Last Updated

Published

Data Center/Project

Level 1 and Atmosphere Archive and Distribution System DAAC (LAADS DAAC)
Land Processes DAAC (LP DAAC)